BNB/USD: Fresh ATH, $50 Next?
Key Support Levels: $48, $47, $46.16.
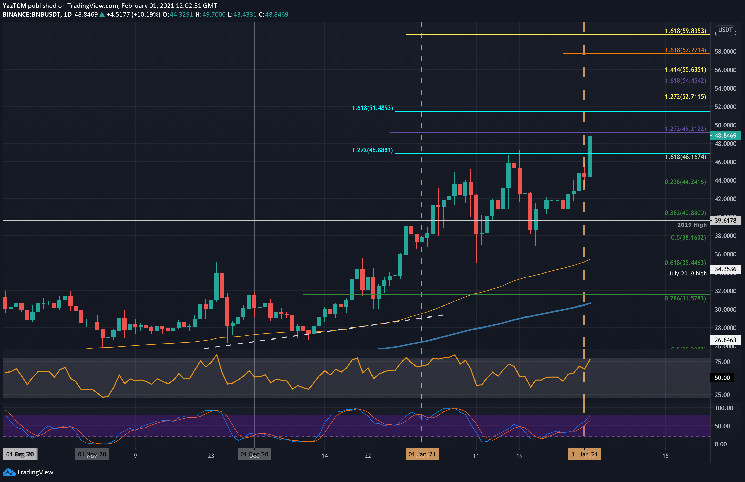
Key Resistance Levels: $50, $51.50, $52.71.
Binance Coin had recorded its previous ATH on January 19th, 2021, when it managed to hit the $47 level. From there, it started to head lower until support was found at $38 on January 21st, which allowed BNB to rebound.
Over the past week, BNB had climbed by a total of 17%. However, today alone, BNB added 9% to its price to break $47 on the way to a new all-time high price of $49.70, as of writing these lines.
BNB-USD Short Term Price Prediction
Moving forward, the first level of resistance beyond the ATH area of $49.21 lies at the psychological level of $50. Further above, resistance is located at $51.50, $52.71 (1.272 Fib Extension – yellow), $54.45 (1.618 Fib Extension – purple), and $55.63 (1.414 Fib Extension – yellow).
On the other side, the first support lies around the $48 mark. This is followed by $47 (previous ATH, where BNB is trading now), $46.16, and $42.24 (.236 Fib). Further support is found at $40.88 (.382 Fib) and $39.61 (2019 High).
The RSI has pushed higher to near overbought conditions but still has room for the bullish momentum to go higher, indicating new ATHs are still on the way.
BNB/BTC: Bulls Rebound From 0.0025 BTC Support
Key Support Levels: 0.00135 BTC, 0.00129 BTC, 0.0012 BTC.
Key Resistance Levels: 0.00143 BTC, 0.0015 BTC, 0.00168 BTC.
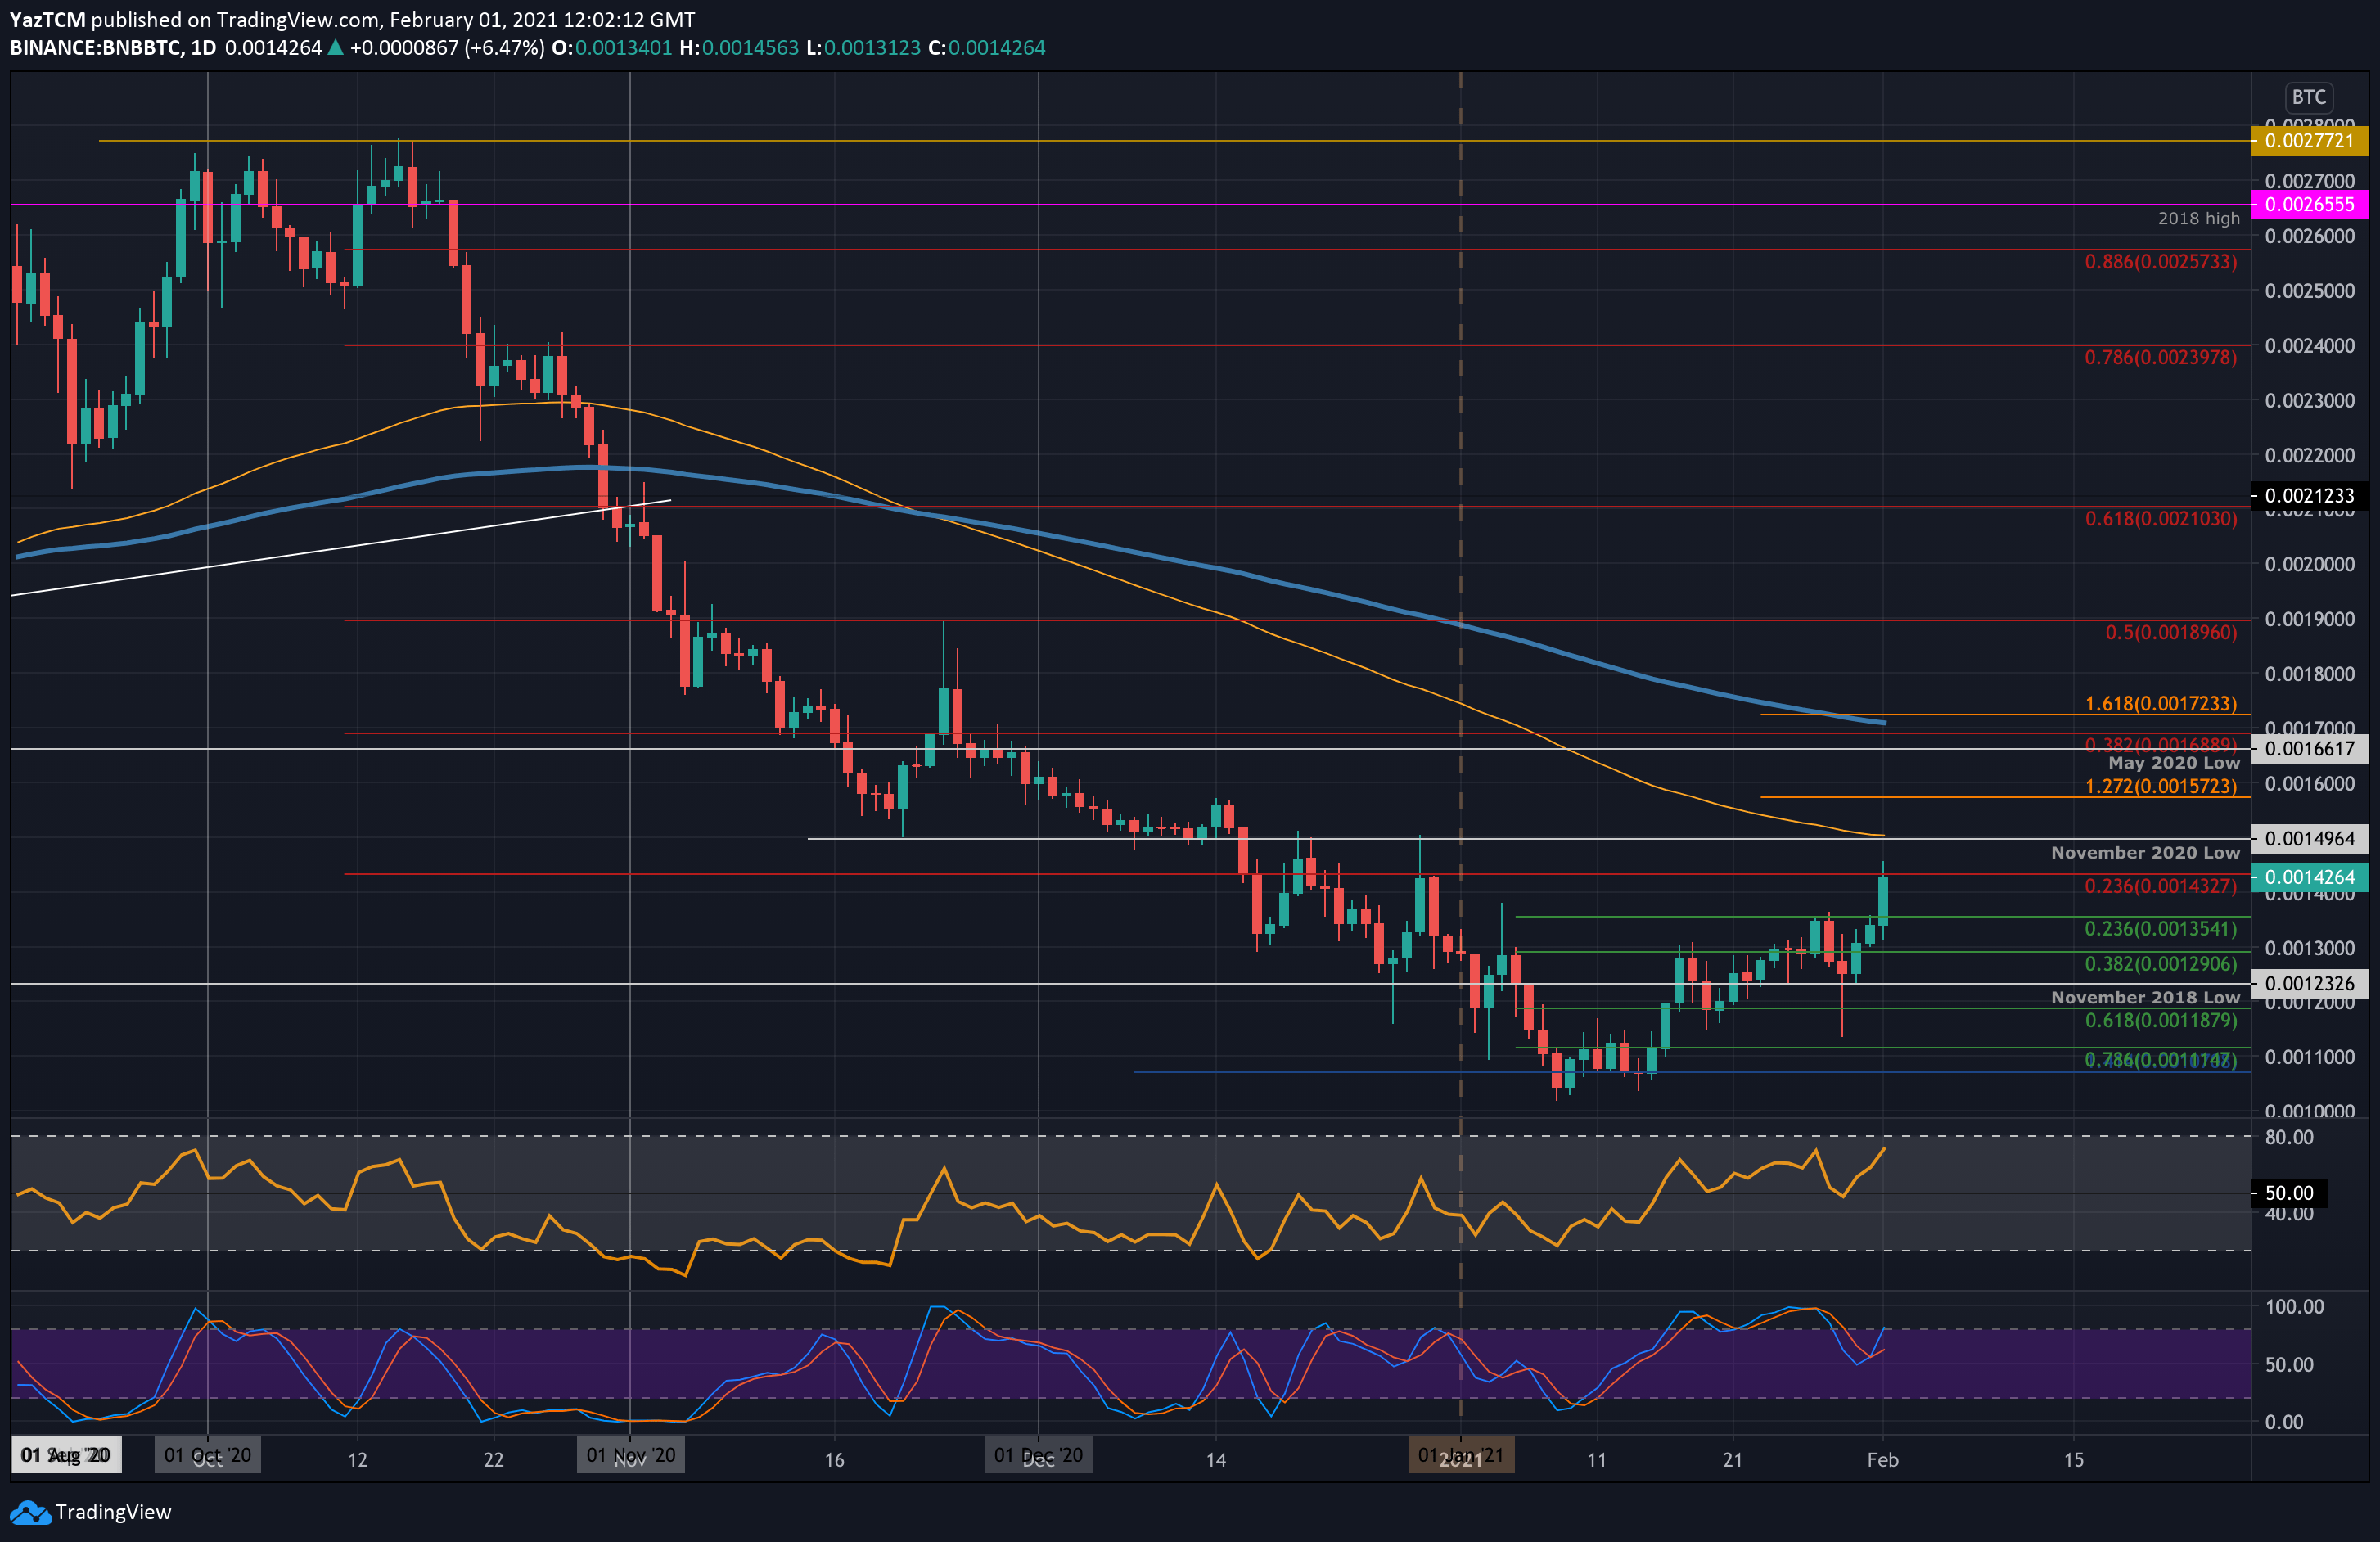
BNB had rebounded earlier in the year near the 0.001 BTC level as it started to reverse from the steep 60% price fall it witnessed since November 2020, while the Bitcoin rally was intact.
Today, it pushed higher against Bitcoin as it broke the previous resistance at 0.00135 BTC to hit the current resistance at 0.00143 BTC, provided by a bearish .236 Fib Retracement.
BNB-BTC Short Term Price Prediction
Looking ahead, once the bulls break 0.00143 BTC, the first level of resistance lies at 0.00149 BTC (November 2020 low & 100-day EMA). This is closely followed by 0.0015 BTC (1.272 Fib Extension), 0.00168 BTC (bearish .382 Fib & 200-days EMA), and 0.00189 BTC (bearish .5 Fib).
On the other side, the first support lies at 0.00135 BTC (.236 Fib). This is followed by 0.00129 BTC (.382 Fib), 0.0012 BTC (Nov 2018 low), and 0.00118 BTC (.618 Fib).
The RSI has also pushed higher here, indicating increased bullish momentum, and is still not yet overbought.