Key highlights:
- Ethereum is down by a sharp 10% today as the cryptocurrency drops into the support at $2,500.
- Despite the price drop, ETH still remains inside the current symmetrical triangle consolidation pattern.
- Against Bitcoin itself, Ethereumbroke crucial resistance at ₿0.074 this week and pushed as high as ₿0.077 - signalling a bull run could be back on the table vs BTC.
Buy Ethereum on Binance
| Ethereum price | $2,548 |
|---|---|
| Key ETH resistance levels | $2,600, $2,700, $2,800, $2,890, $3,000 |
| Key ETH support levels | $2,500, $2,400, $2,335, $2,220, $2,000 |
*Price at the time of writing
When BTC drops, so do all of the altcoins and today is no difference. After the sharp 9.5% BTC price dump, ETH is also down by a total of 10% today as it drops beneath $2,500. The cryptocurrency has been trading inside a consolidation pattern since the mid-May market-wide capitulation and was testing the upper boundary of this pattern last week.
Unfortunately, ETH was unable to overcome the upper boundary of the triangle nad started to head lower from there over the weekend. Despite today’s 10% price fall, ETH still remains inside the current symmetrical triangle pattern after rebounding from the lower boundary today to trade at the current $2,500 level.
It seems that the Etehreum crowd sentiment is pretty bearish right now. However, Santiment actually believes that this negative sentiment might actually help to push ETH above the current crucial resistance at $2,800:
? #Ethereum is +20% over #Bitcoin's +6%, and the crowd's negative perception toward $ETH right now, according to our data, may just be fueling the price higher. We're seeing commentary is more #bearish than usual, which very often pushes prices upward. https://t.co/DxO899ndip pic.twitter.com/5nu3wn8mQb
— Santiment (@santimentfeed) June 6, 2021
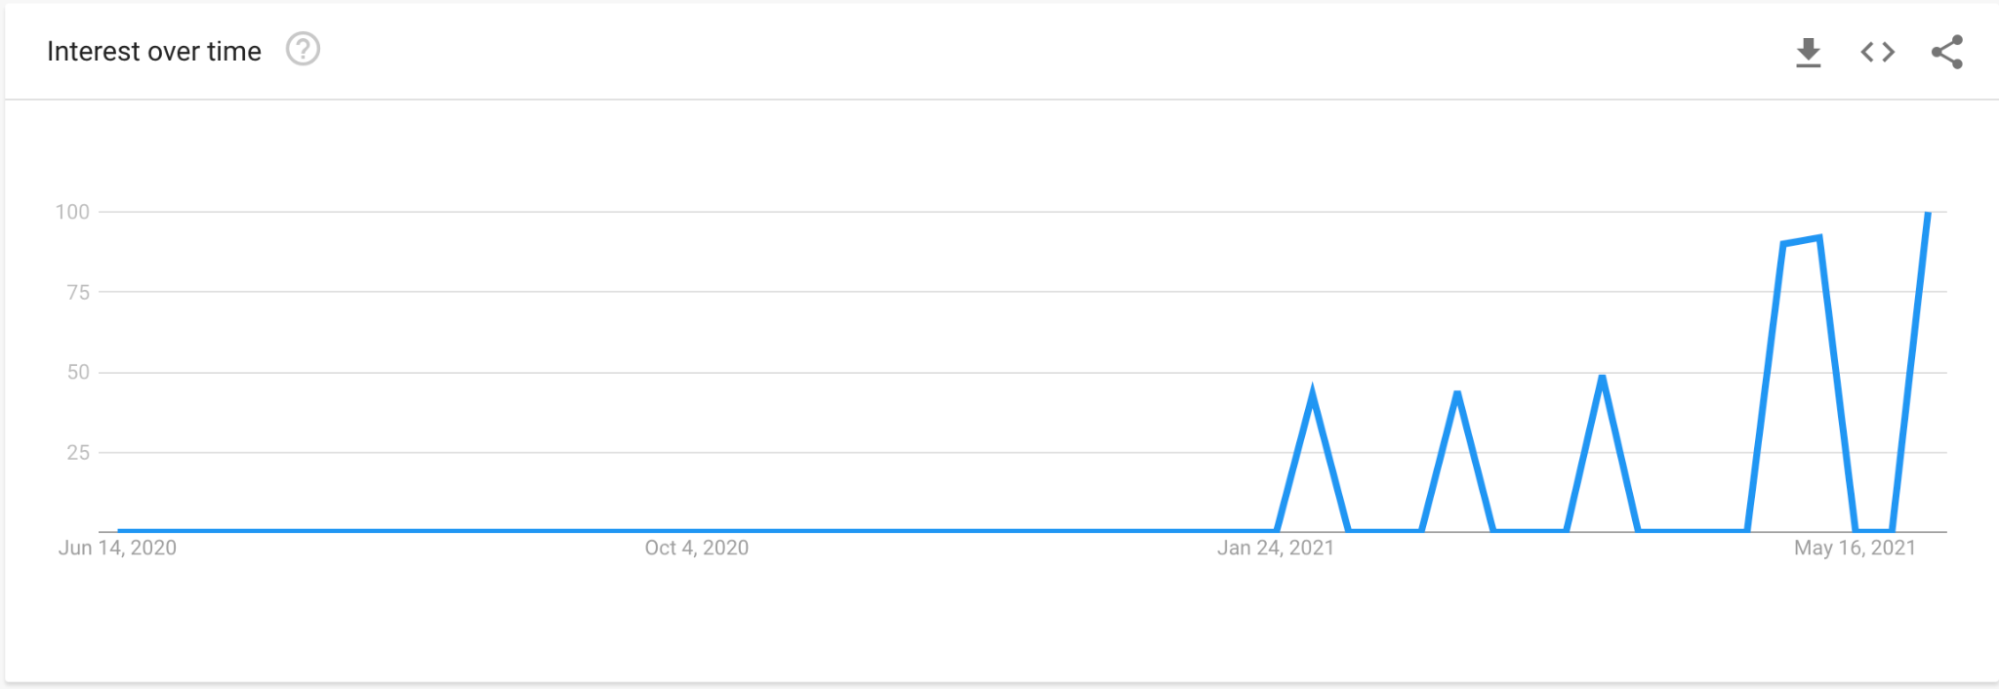
Despite this negative sentiment, ETH recently managed to break crucial resistance against BTC itself after it surged above ₿0.074 this week to break the ascending triangle it was trading within. Interestingly, Google Search Trend data for the word ‘flippening’ seems to be at all-time highs right now as ETH maximalists continue to explore the narrative of ETH overtaking BTC:
However, if we are to take a closer look at the corelation between BTC and ETH we will notice that the two assets still remain highly correlated:
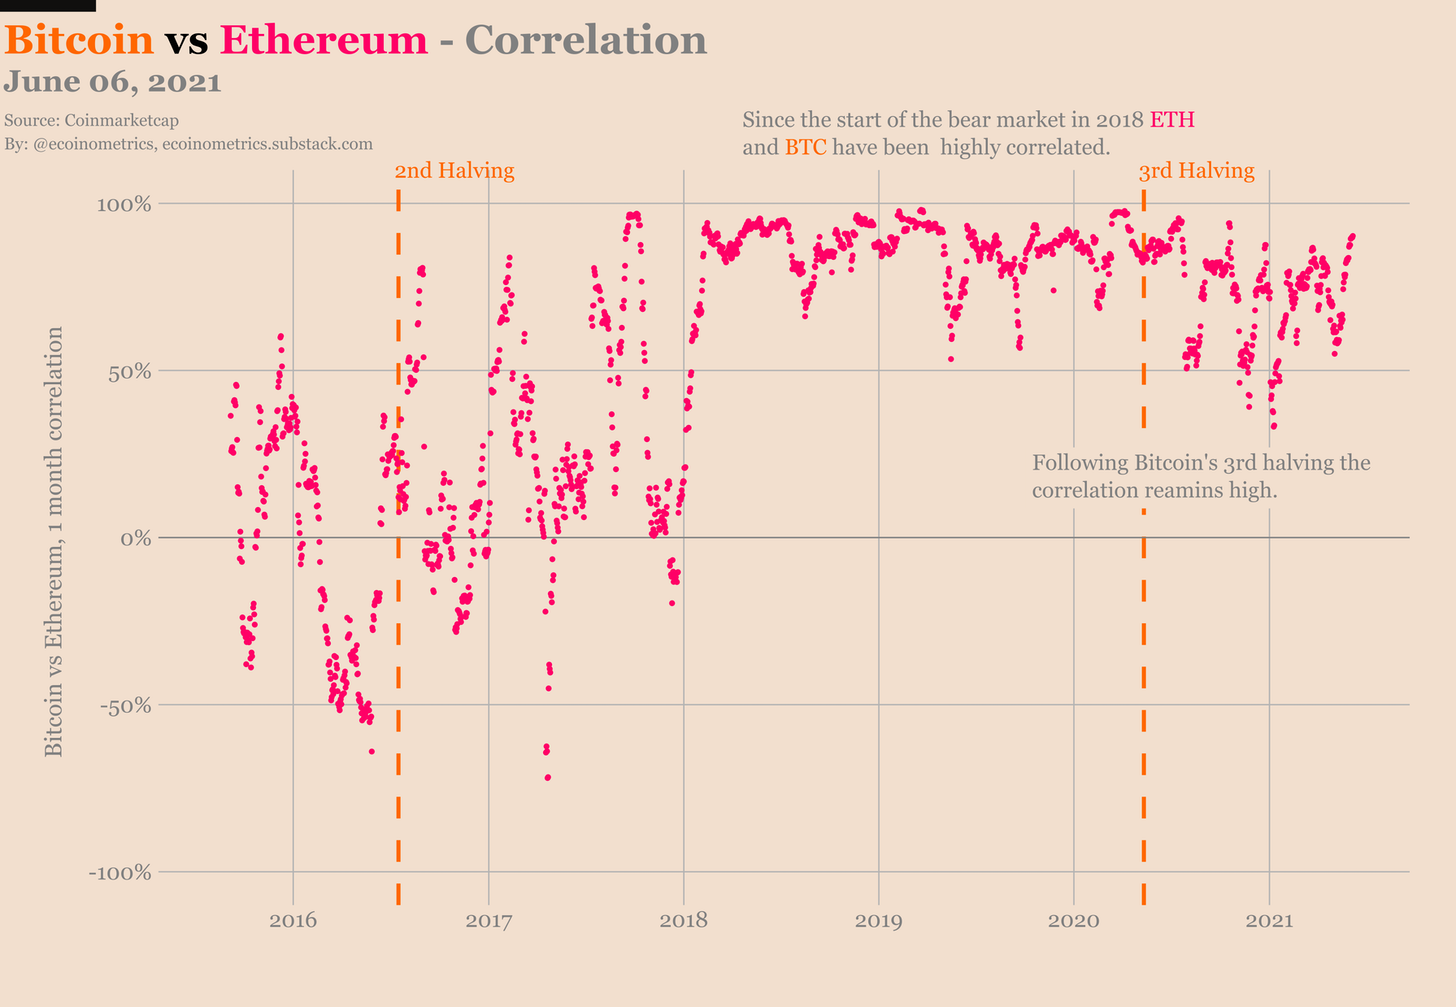
Source: https://ecoinometrics.substack.com/p/ecoinometrics-the-decoupling
Looking at the chart above, we can see that since the end of the 2018 bull run, ETH has been highly correlated to BTC and has spent minimal time beneath the 50% correlation thereshold. This shows that ETH is still at the whim of BTC. When BTC drops, so will ETH. ETH won’t create new ATHs unless BTC remains bullish.
For a flippening to occur, ETH would have to become negatively correlated with BTC, or at the very least, uncorrelated. It seems that it is still a long way away and we should not be expecting any time of flippening between BTC and ETH anytime soon.
Ethereum remains the 2nd largest cryptocurrency asset as it currently holds a $287 billion market cap value.
Let us continue to take a look at the markets and see where they might be heading.
Ethereum Price Analysis
What has been going on?
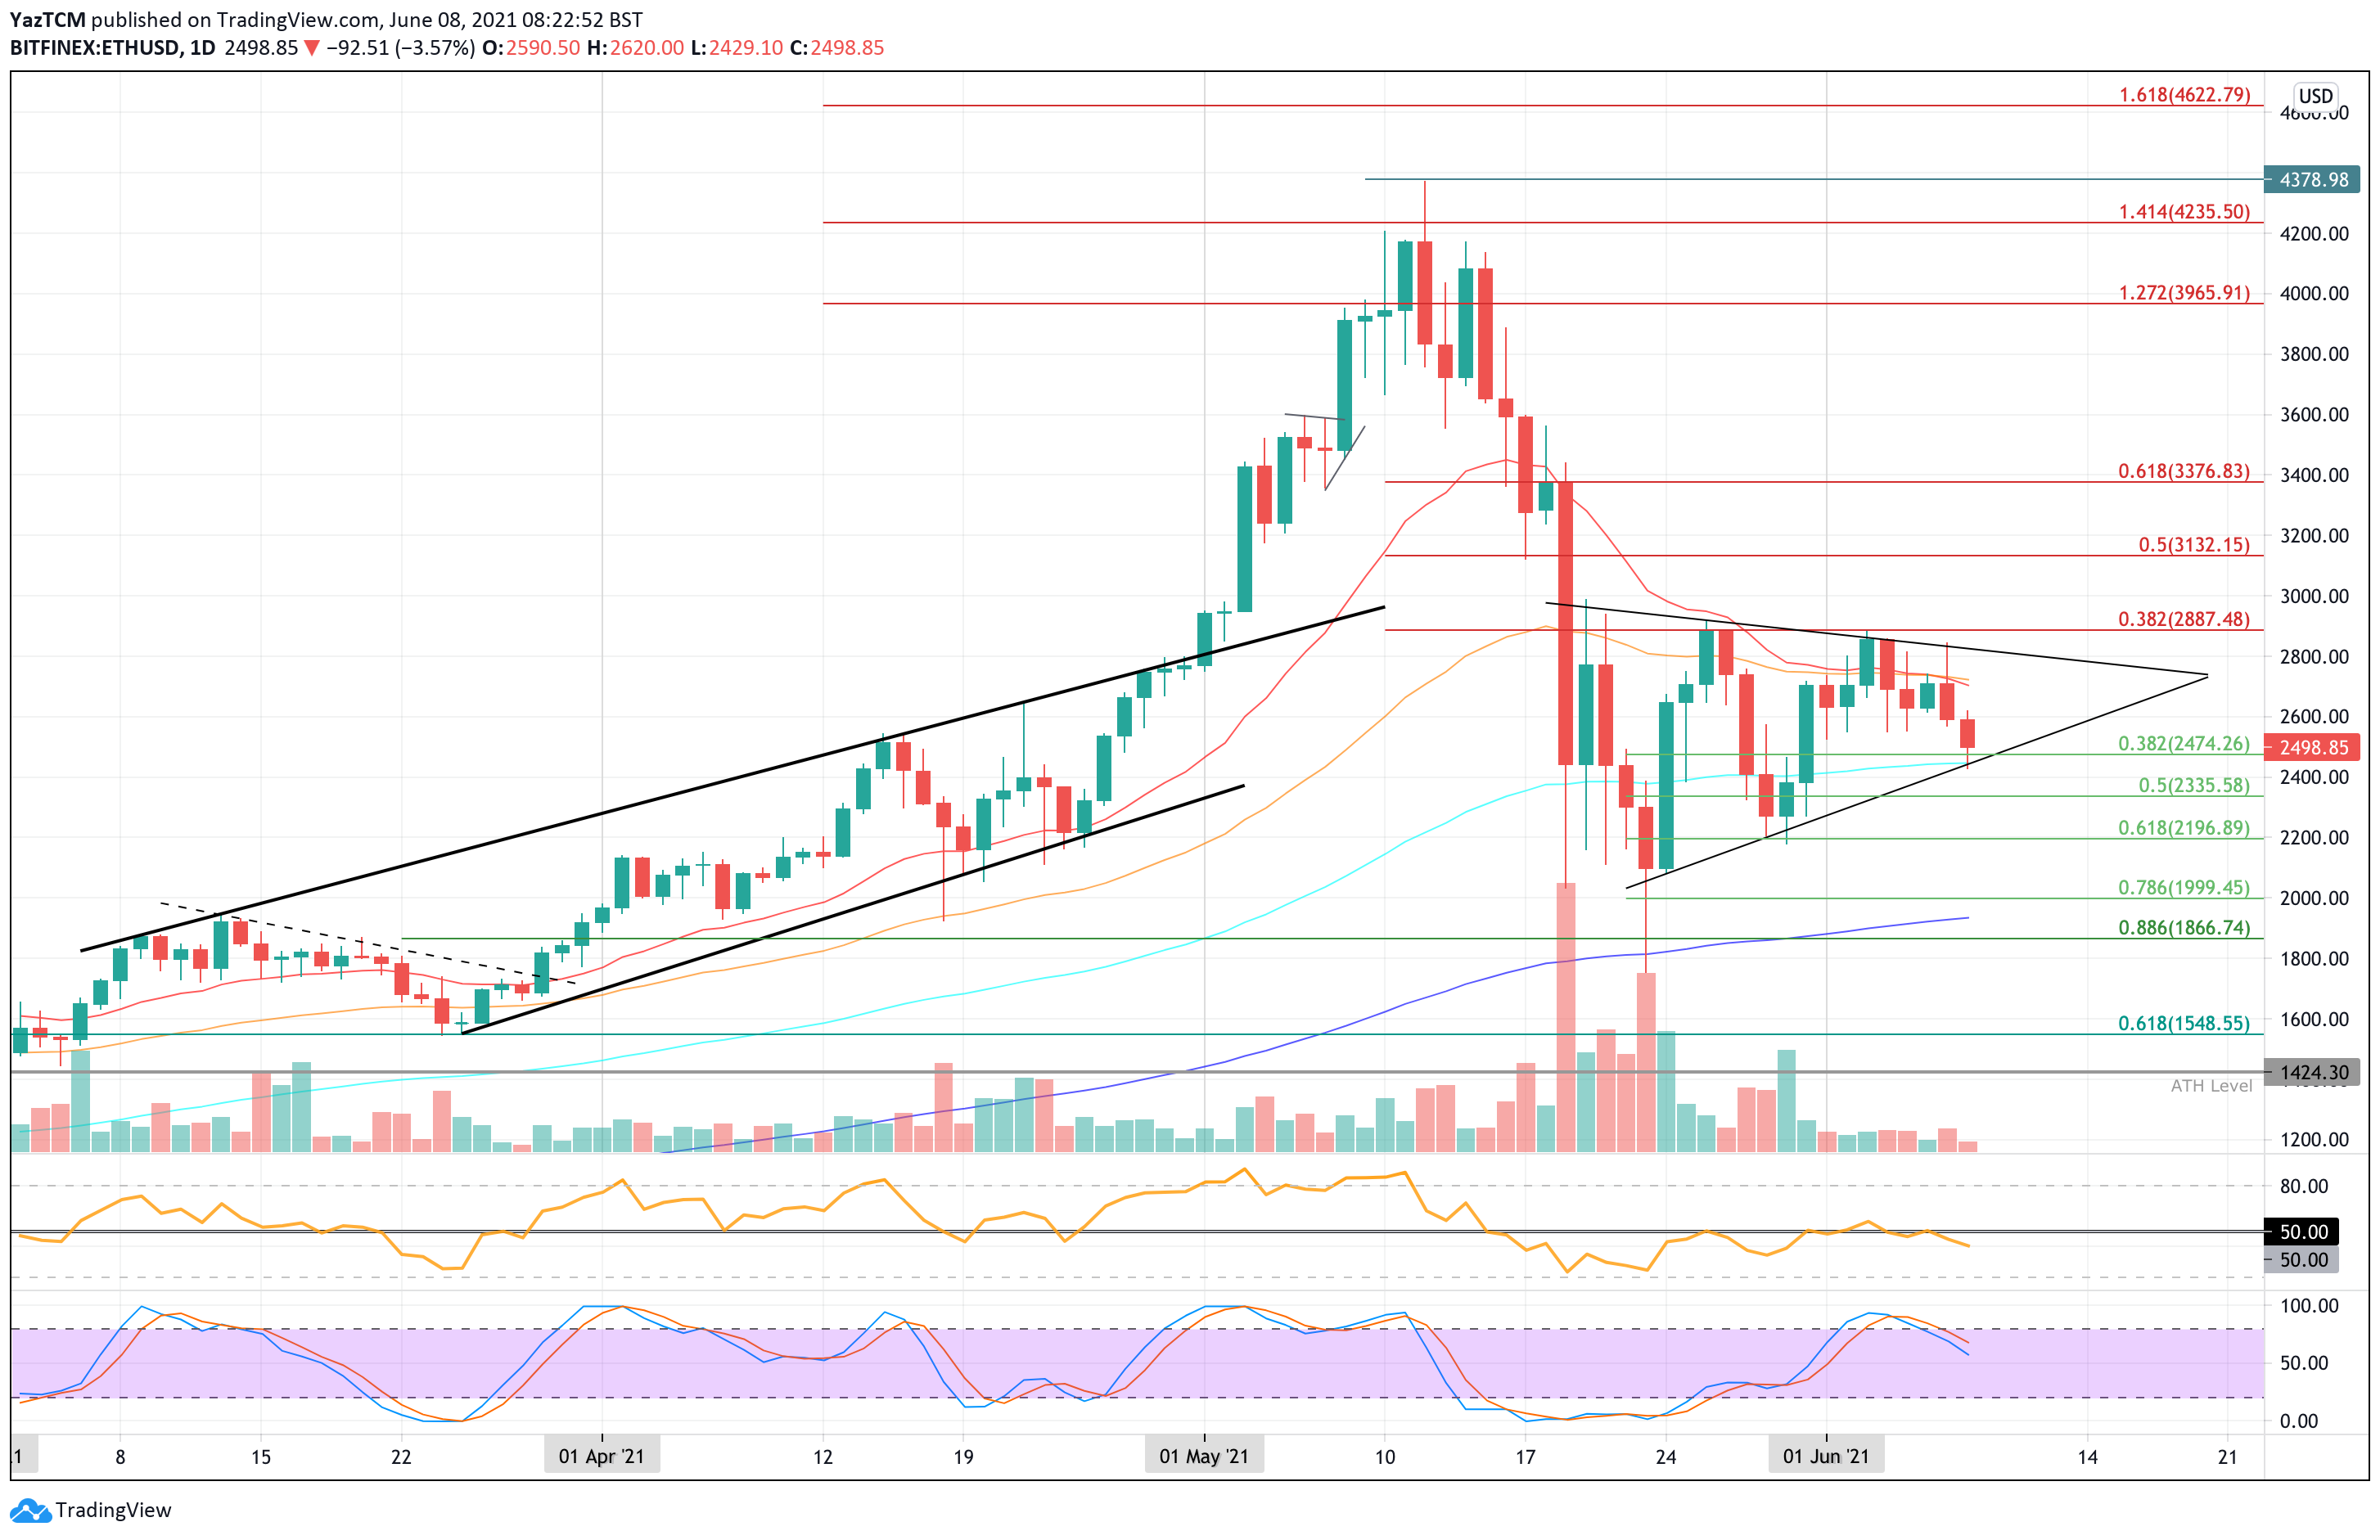
Taking a look at the daily chart above, we can see that ETH is currently trading inside a symmetrical triangle pattern. There is strong resistance above the triangle at $2887 (bearish .382 Fib Retracement) and the buyers have struggled to break this resistance on the last two attempts at the level.
Last week, ETH attempted to break the upper boundary of the triangle but failed to overcome it and headed lower over the weekend as a result. Today, the sharp 10% price drop caused ETH to drop into the lower boundary of the triangle as it found support at around $2,450 (20-day MA). It has since bounced from there and is battling to remain above $2,500.
Ethereum price short term prediction: Neutral
Etheruem has to be considered neutral right now. The coin would need to break back above $3,000 before we can start to consider a bullish market again. On the other side, it would still need to break beneath $1,800 (200-day EMA) before we can confirm a bearish market.
If the sellers push lower, the first support lies at $2,450 (20-day MA & lower boundary of the triangle). This is followed by $2,400, $2,335 (.5 Fib), $2,200 (.618 Fib), and $2,000.
Where Is The Resistance Toward The Upside?
On th eother side, the first resistance lies at $2,600. This is followed by $2,700 (50-day MA), $2,800 (triangle upper boundary), $2,887 (bearish .382 Fib), and $3,000.
What has been going on?
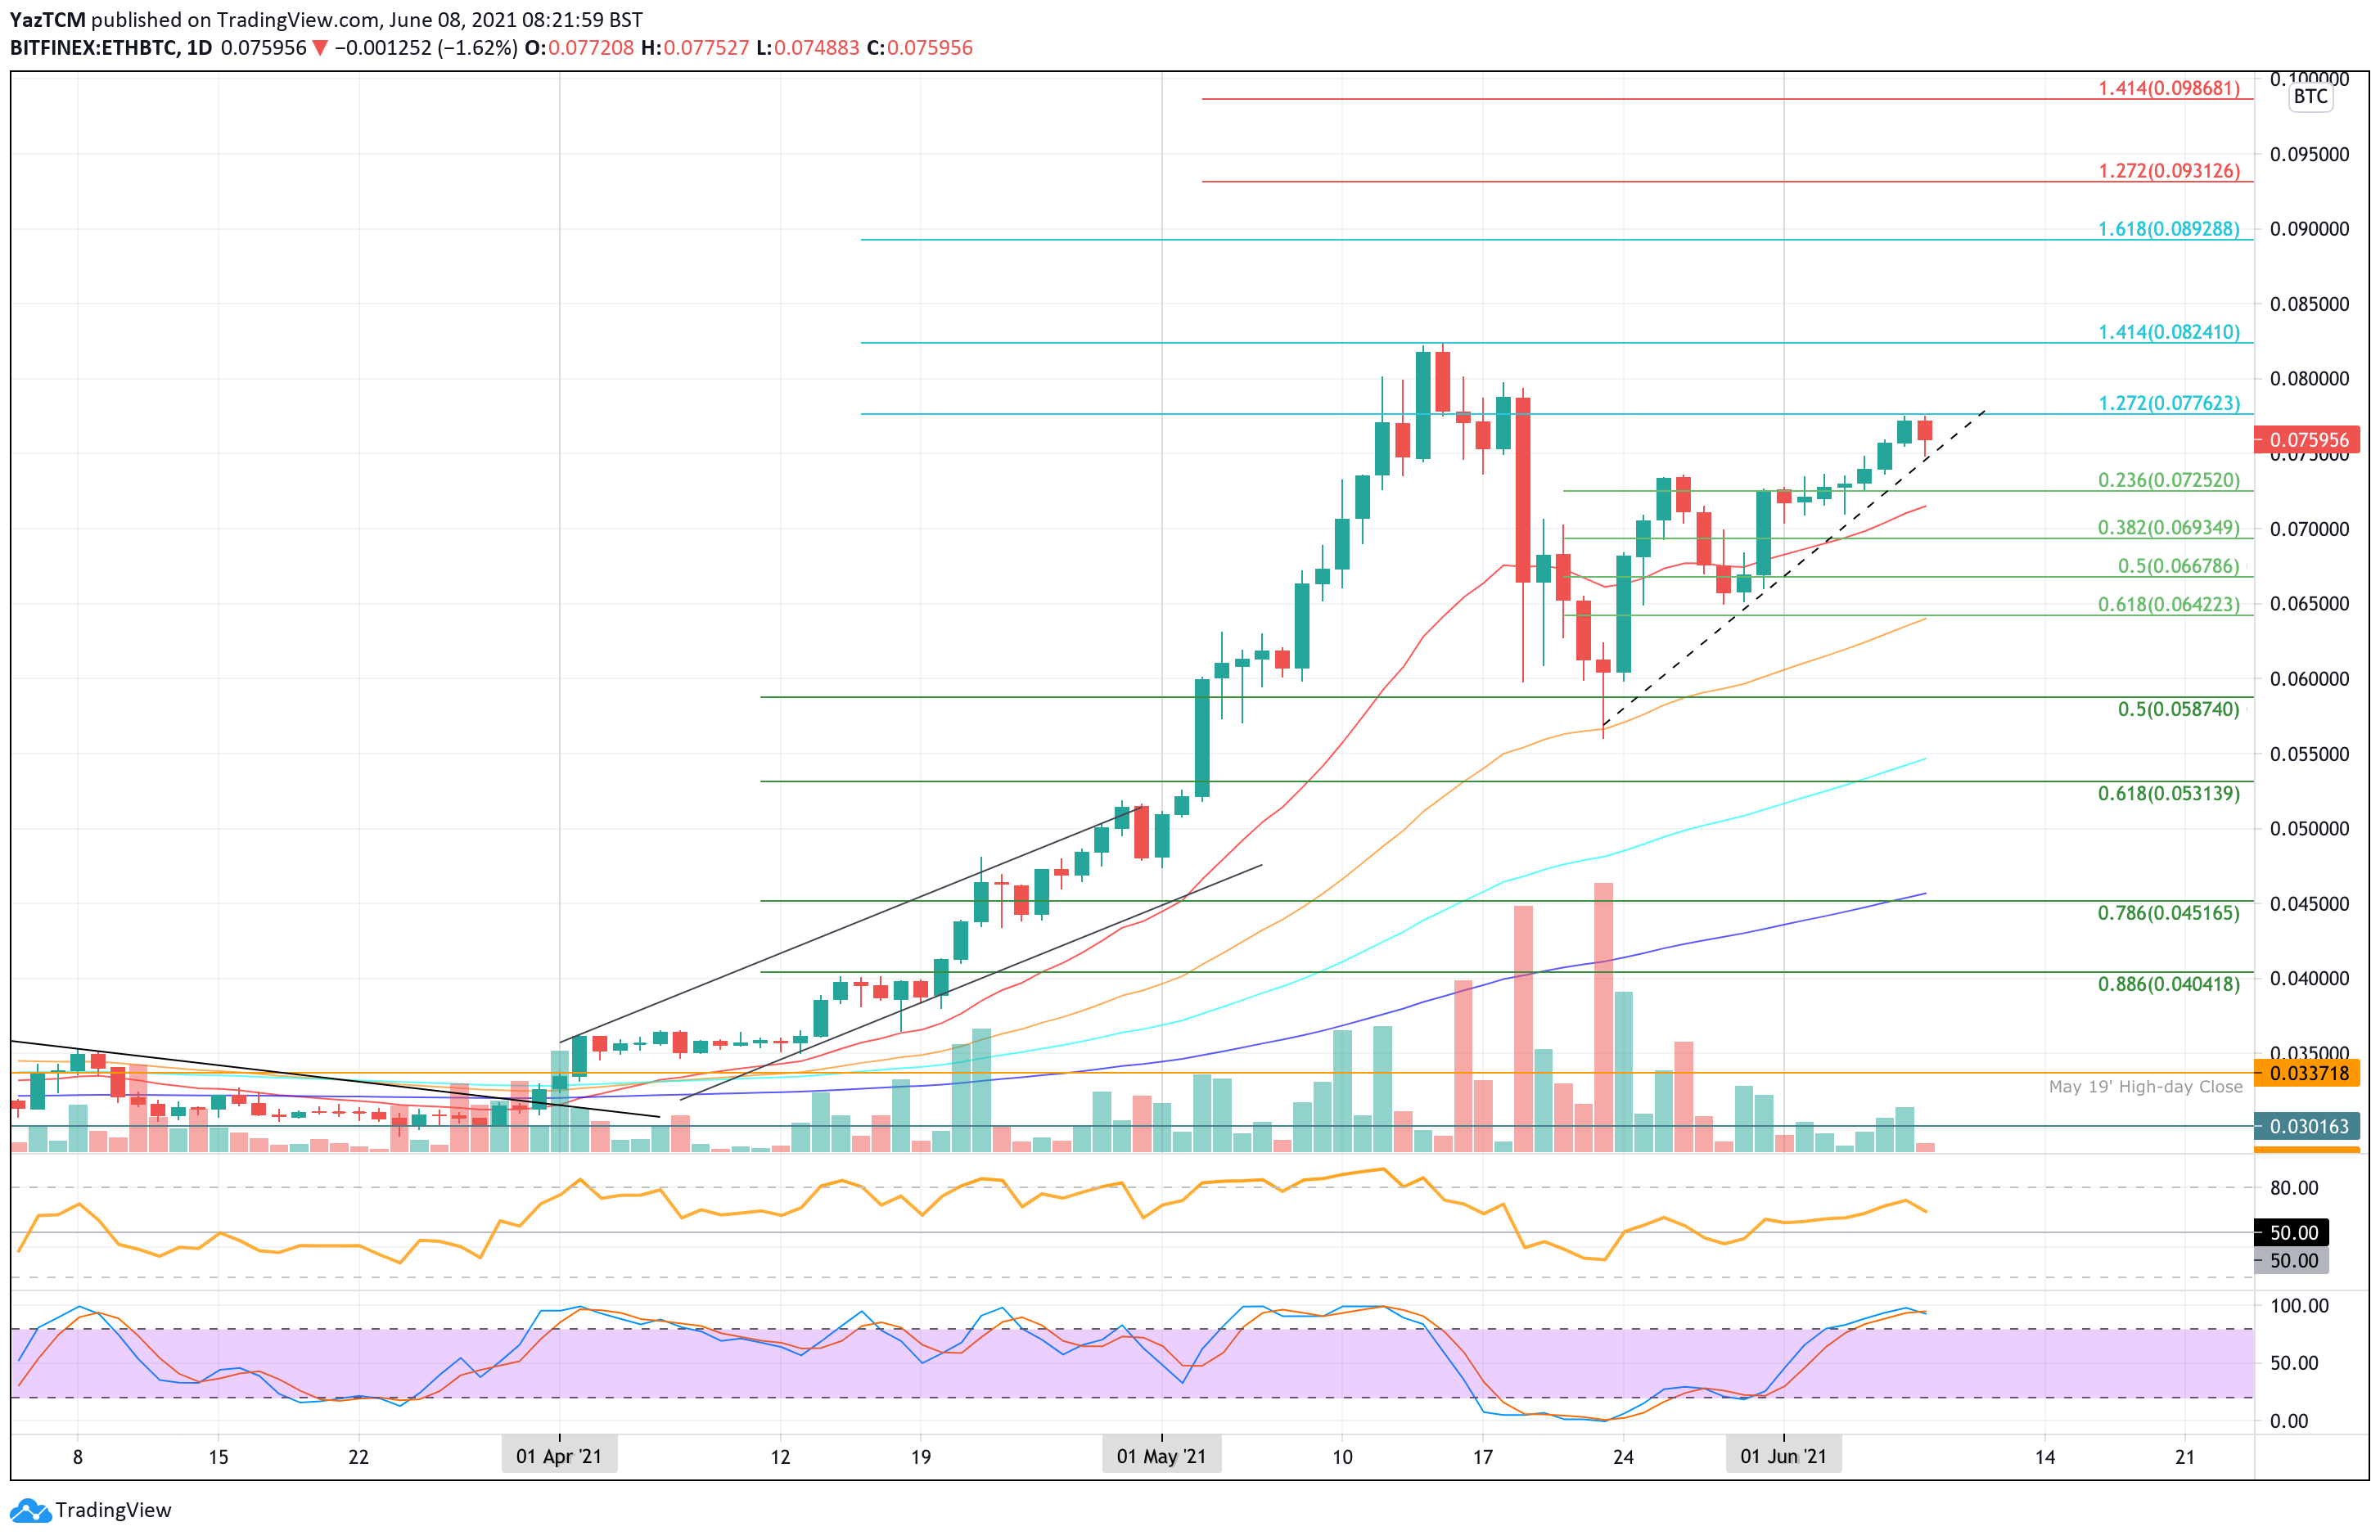
ETH is performing slightly better against BTC this week as it managed to break the resistance at ₿0.074. This resistance formed the upper boundary of the previous ascending triangel pattern and the breakout turned ETH/BTC bullish in the short term.
Since breaking the triangle, ETH continued higher to reach the resistance at ₿0.0776 (1.272 Fib Extension) but has since dropped to the current ₿0.0759 level.
Ethereum price short term prediction: Bullish
Ethereum is still considered bullish against Bitcoin in the short term. To turn neutral, it would need to fall beneath ₿0.0642 (50-day MA). It would have to fall further beneath the support around ₿0.055 (200-day EMA) to be in danger of turning bearish in the short term.
If the sellers push lower, the first support lies at ₿0.075. This is followed by support at ₿0.0725 (.236 Fib), ₿0.07 (.382 Fib), and ₿0.0667 (.5 Fib).
Additional support is then located at ₿0.0642 (.618 Fib & 50-day MA) and ₿0.06.
Where Is The Resistance Toward The Upside?
On the other side, the first strong rresitance lies at ₿0.0776 (1.272 Fib extension). This is followed by resistance at ₿0.08, 824 (1.414 Fib Extension), ₿0.085, and ₿0.0892 (1.618 Fib Extension).
Keep up to date with the latest ETH price predictions here.
Previous ETH analysis
At CoinCodex, we regularly publish price analysis articles focused on the top cryptocurrencies. Here's 3 of our most recent articles about the price of Ethereum:
- Ethereum Price Analysis - ETH Bulls Begin Recovery With 9% Rebound But Still Need To Overcome $2,895 (Bullish)
- Ethereum Price Analysis - ETH Rebounds From $2,000 Support To Meet Resistance at $2,800 - Can It Break Above? (Bullish)
- Ethereum Price Analysis - ETH Finds Support At 100-day EMA - Will It Prevent Further Declines? (Bullish)