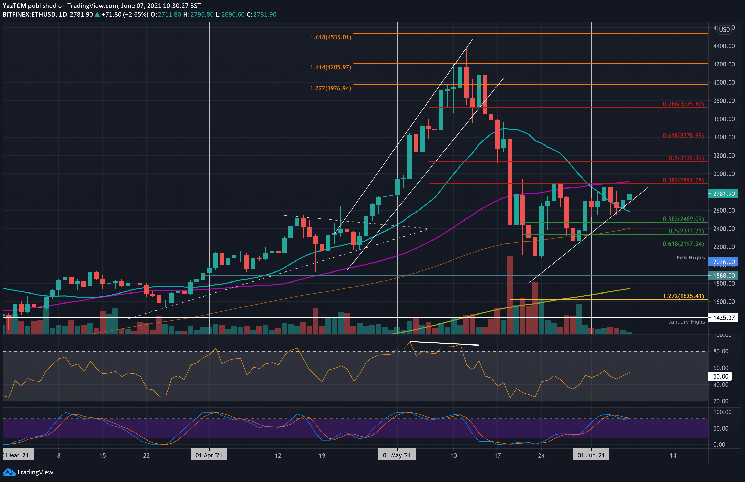
ETH/USD – Market Continues Consolidation Inside Triangle.
Key Support Levels: $2715, $2600, $2470.
Key Resistance Levels: $2892, $3000, $3135.
ETH is up by a substantial 18% over the week as it trades at around $2800 but still resides inside the ascending triangle pattern. The roof is at $2891 (bearish .382 Fib), and ETH has been stuck here for the past fortnight.
It tested the upper boundary of the triangle last week but failed to overcome it. As a result, ETH headed lower over the weekend to find the support at the lower arm of the triangle at $2600. It has since bounced from this support to trade at $2781.
ETH-USD Short Term Price Prediction
Looking ahead, the first resistance lies at $2892 (bearish .382 Fib & 50-day MA). This is followed by $3000, $3135 (bearish .5 Fib), and $3380 (bearish .618 Fib).
On the other side, the first support lies at the lower boundary of the triangle at $2715. This is followed by $2600 (20-day MA), $2470 (.382 Fib), and $2400 (100-day MA).
The RSI continues to straddle the midline, indicating indecision within the market. For a breakout toward the upside of the triangle, the RSI must make a higher high above 57 to show increased bullish momentum.
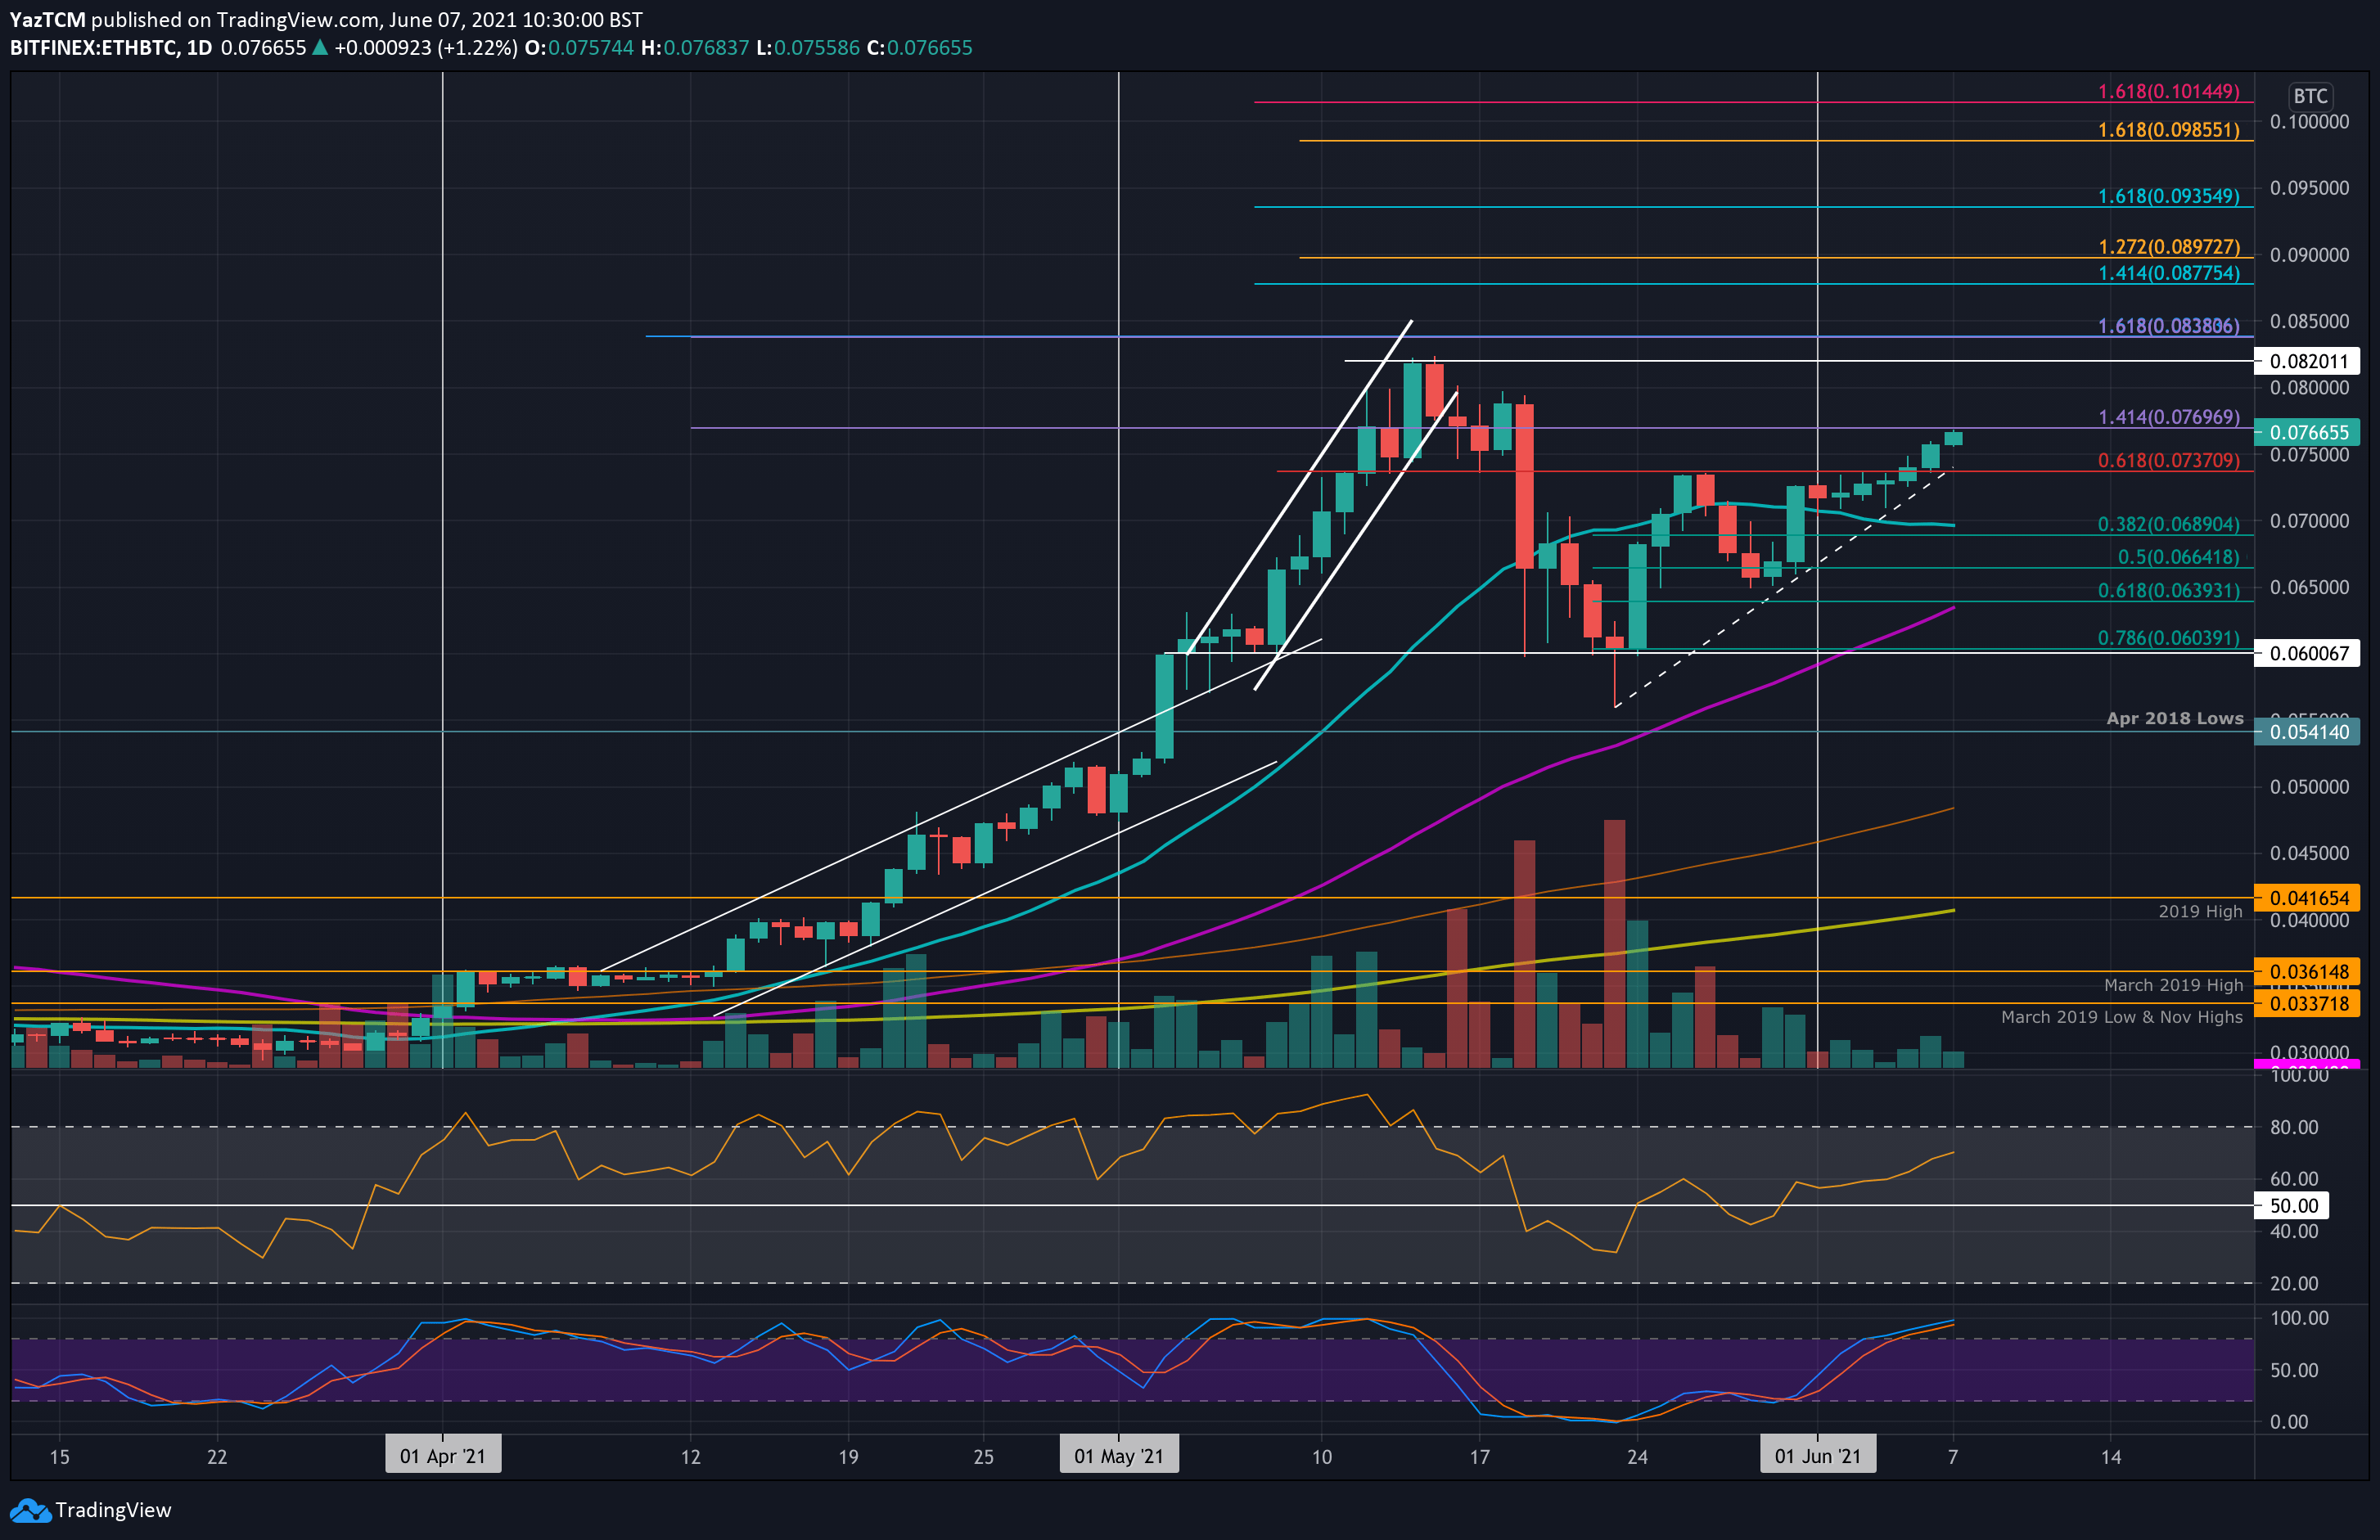
ETH/BTC – ETH Breaks Ascending Triangle Vs. BTC
Key Support Levels: 0.0737 BTC, 0.07 BTC, 0.0664 BTC.
Key Resistance Levels: 0.0769 BTC, 0.08 BTC, 0.082 BTC.
Against bitcoin, ETH finally broke the ascending triangle it was trading inside over the past fortnight. The roof of this pattern was at 0.0737 BTC (bearish .618 Fib), and the market managed to break above the triangle yesterday.
Since breaking above the triangle, ETH pushed higher beyond 0.075 BTC and is now testing resistance at 0.0769 BTC (1.414 Fib Extension).
ETH-BTC Short Term Price Prediction
Looking ahead, if the first resistance lies at 0.0769 BTC (1.414 Fib Extension). This is followed by 0.08 BTC, 0.082 BTC (HDC), 0.0838 BTC (1.618 Fib Extension), and 0.0877 BTC (1.414 Fib Extension).
On the other side, the first strong support lies at 0.0737 BTC. This is followed by 0.07 BTC (20-day MA), 0.0664 BTC (.5 Fib), 0.0639 BTC (.618 Fib & 50-day MA), and 0.06 BTC.
The RSI is in the bull’s favor here as it rises beyond the midline. There is still room to push higher before the market becomes overbought, indicating ETH can continue to rise against BTC.