The whole cryptocurrency market was a witness to the bull’s grand entry this week, with several currencies surging in double digits. This rise in the price was one of the most awaited one by all investors and enthusiasts as all the coins were suffocating because of the bear’s tight grip.
According to CoinMarketCap, at press time, Ethereum was trading at $102.60, with a market cap of $10.65 billion. The cryptocurrency shows a trade volume of $2.47 billion and has surged by over 13% in the past seven days.
1-hour
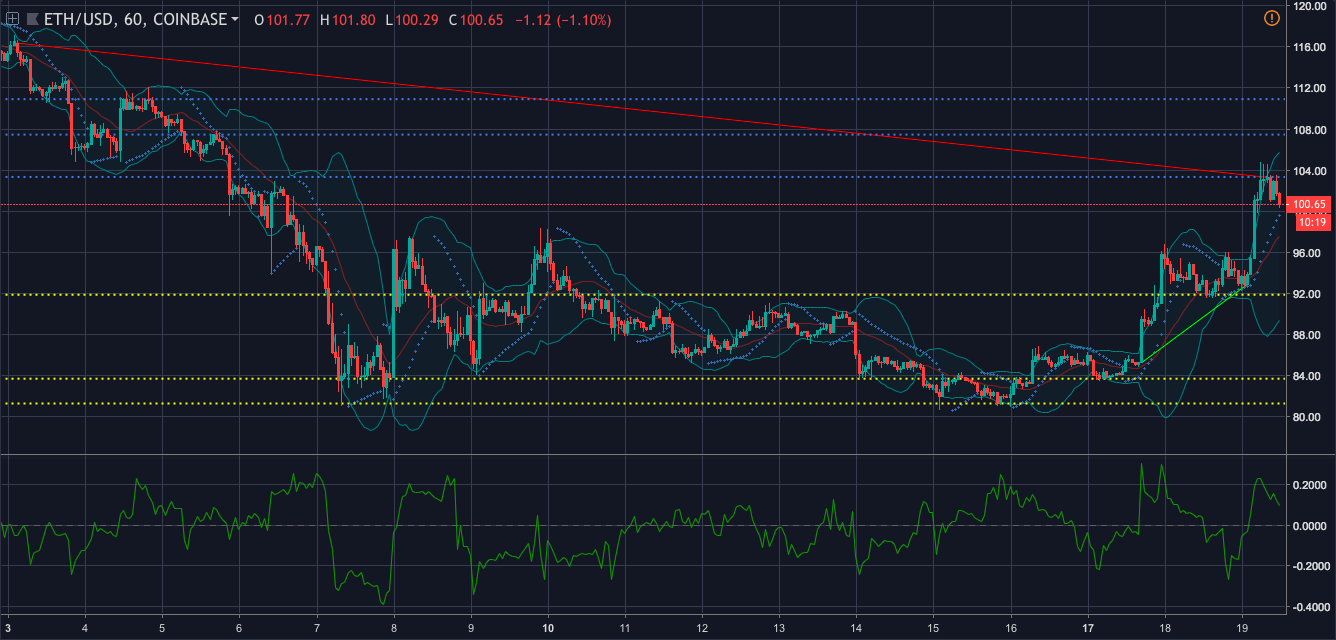
Ethereum one-hour price chart | Source: Trading View
In the one-hour chart, the cryptocurrency shows a downtrend from $116.36 to $103.30. The chart also demonstrates an uptrend from $85.26 to $92.91. The immediate resistance for the cryptocurrency is set at $103.33 and the strong resistance is set at $110.91. The cryptocurrency has found its immediate support ground at $91.87 and a strong support ground at $81.28.
Bollinger Bands are forecasting a volatile market for the coin as the bands have started to part from each other.
Chaikin Money Flow is showing a bullish wave as it is indicating that the money has started to flow into the market.
Parabolic SAR is also on the bullish side as the dots have aligned below the candlesticks.
1-day
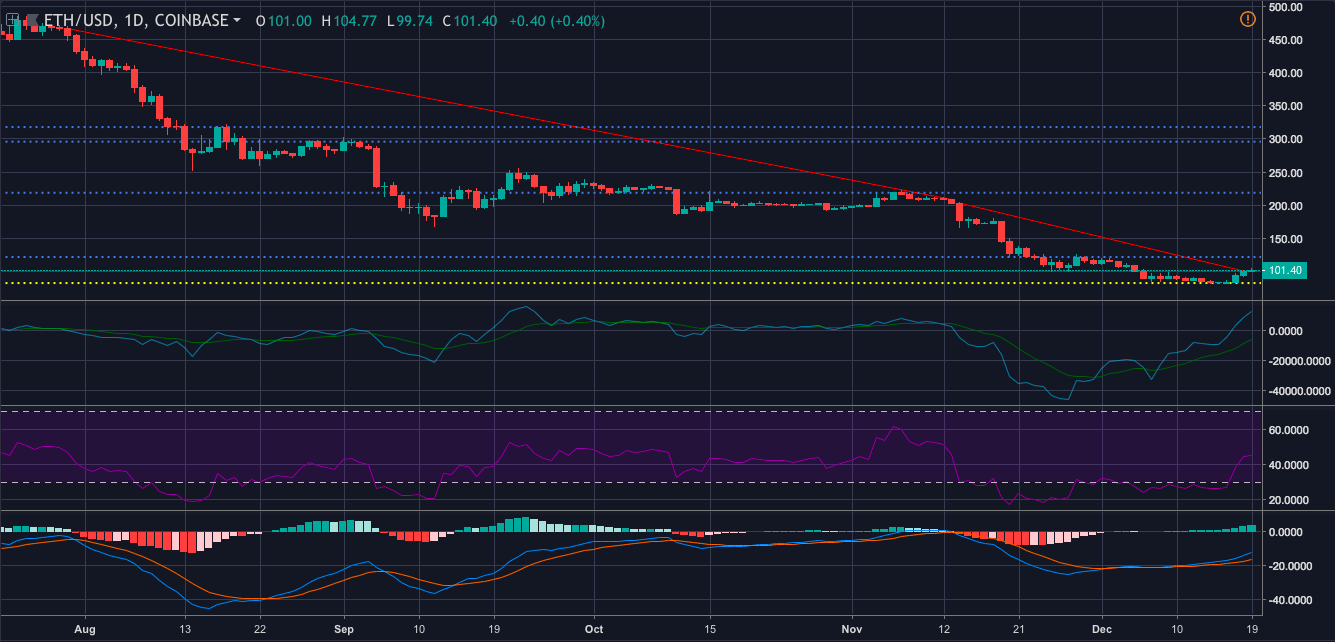
Ethereum one-day price chart | Source: Trading View
In the one-day chart, the cryptocurrency demonstrates a downtrend from $466.01 to $208.77. It also pictures another steep fall from $203.20 to $101. The immediate resistance for the coin is set at $122.07 and the strong resistance is set at $218.86. The support can be spotted at $82.87.
MACD shows that the moving average line has made a bullish crossover, predicting that the coin is going green.
Klinger Oscillator is also on the same page, as the reading line has made a bullish crossover.
RSI shows that the buying pressure and the selling pressure are currently evened out in the market.
Conclusion
The bull has successfully regained its position in the market with the support of Parabolic SAR, and CMF from the one-hour chart and the MACD and Klinger Oscillator from the one-day chart.