- Ethereum has hit a major milestone as they surpass the 50 million unique addresses mark.
- The market has rebounded from expected support at $84.03.
- Support moving forward: $84.03, $80, $72.73, $67.09, $63.80, $58.99.
- Resistance moving forward: $90, $92, $100, $105.55, $108.08, $110.87, $118.
Latest Ethereum News
The Ethereum network has recently hit a major milestone as the total number of unique addresses surpasses the 50 million mark, a great achievement for any cryptocurrency project.
On average, there are around 70,000 unique addresses that are added each day which shows that the Ethereum network is still growing.
However, this should not be misunderstood for active Ethereum addresses, which have fallen significantly.
The number of active Ethereum addresses, addresses which have sent or received Ethereum transactions on any given day, has dropped by a significant 68% from its peak, one of the severe repercussions of the drawn out bearish market that Ethereum has undergone.
To add to Ethereum’s predicament, according to data from Santiment, a company that provides cryptocurrency stats and analysis, ICOS have sold over 400,000 ETH in the past 30 days, with SingularDTV, Aragon and the Kobe’s Network leading the selling charge.
It can presumed that as the price of Ethereum continues to drop, the ICO projects need to sell more ETH to pay for the expenses to keep the project running.
In recent positive news for Ethereum, Opera, one of the world’s leading fast and secure web-browsers, has recently announced and released an update that they claim to be Web 3.0 ready as it integrates a built-in Ethereum wallet.
Let us take a look at Ethereum over the short term and highlight any potential areas of support and resistance moving forward.
Ethereum Price Analysis
Ethereum has remained extremely stable over the past 24-hour trading period as the market has only moved a negligible -0.08%.
The cryptocurrency is now exchanging hands around a price of $88.20, at the time of writing, after suffering a 6.64% price decline over the past 7 trading days and a significant 50% price plummet over the past 30 trading days.
The project is now ranked in 3rd position as it currently holds a $9.01 billion market cap value. This is $2.89 billion behind number 2 ranked project, Ripple.
The 40-month old cryptocurrency is now trading at a value that is 93% lower than its all-time high price experienced earlier in the year.
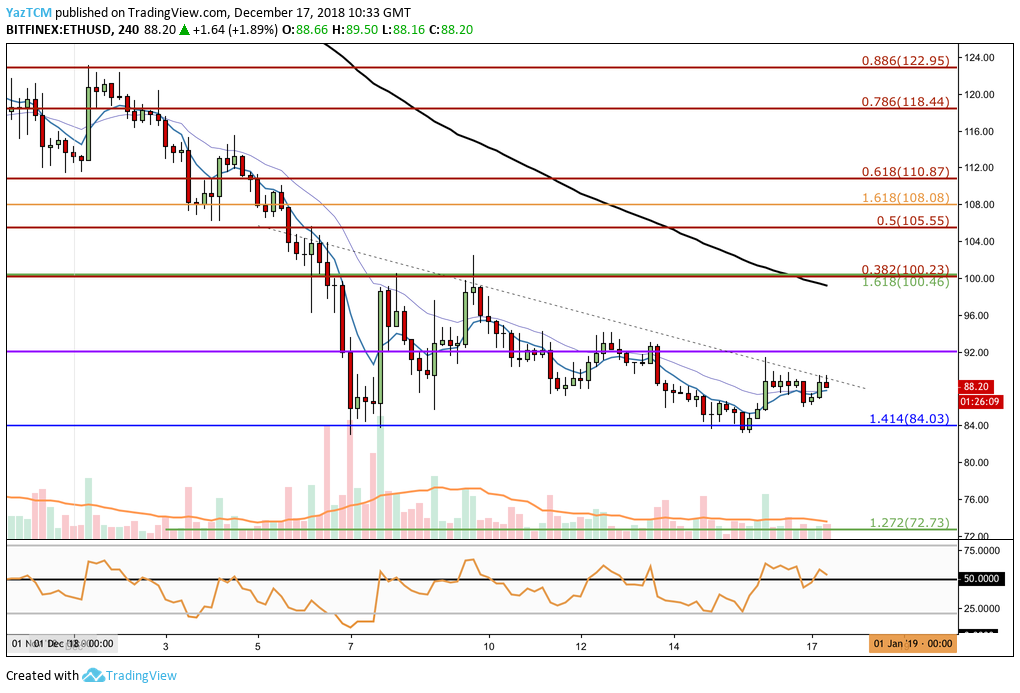
Taking a look at the market from the short-term perspective above, we can see that since our last Ethereum analysis, ETH/USD slipped below the support at $90 and continued to drop right into our outlined support level at the medium-term downside 1.414 Fibonacci Extension level (drawn in blue) priced at $84.03.
Price action rebounded from this support but is still trading below a downward sloping trend line highlighted as a dotted line upon the chart.
Until ETH/USD can break above this trend line, we can expect the selling pressure to continue to suppress the price.
Trend: Bearish Below $84
Price action for ETH/USD has now been trading sideways since rebounding at the $84.03 region, trapped in a range between $84 as the lower boundary and $92 as the upper boundary of the range.
If the sellers manage to push price action below $84, we can assume that the bearish trend is continuing. If the bulls can break above $92, we could see a potential recovery toward the $100 resistance level.
Where is the Support for ETH Below $84?
If the bears manage to break below the support at the medium-term downside 1.414 Fibonacci Extension level (drawn in blue) priced at $84.03, we can expect immediate significant support below to be located at the psychological round number level at $80.
If the selling pressure continues to drop price action further below the $80 handle, we can then expect more support beneath to be located at the short-term downside 1.272 Fibonacci Extension level (drawn in green) priced at $72.73, followed by the downside 1.414 Fibonacci Extension level (not represented on the chart) priced at $67.09.
Where Will the Buyers Find Resistance Above $92?
If the bulls can make another attempt at the $92 handle and break back above, further higher resistance can be expected at the $100 handle.
The $100 handle will require serious momentum to overcome due to the combination of resistance seen within this area.
If the buyers can then continue to break higher above the $100 handle, we can expect further resistance above to be located at the bearish .5 and .618 Fibonacci Retracement levels (drawn in red), priced at $105.55 and $110.87 respectively.
What Are the Technical Indicators Showing?
The RSI has broken above the 50 handle on the 4-hour time frame which indicates that the market is favoring short-term bullish momentum.
On the daily timeframe, the RSI is still well below the 50 handle. However, investors can take some comfort to know that the RSI is now rising once again.
Conclusion
It is no surprise that the active number of Ethereum addresses has dropped significantly, despite the network reaching the 50 million unique address milestone.
The ETH/USD market will need to break above the short-term bearish trend line before being able to climb higher, with the $84.03 support zone now being the crucial level for the bulls to defend to prevent a further market decline.