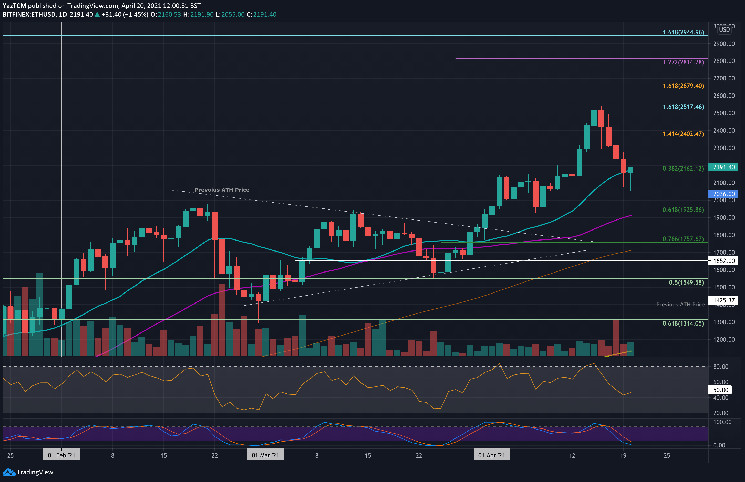
ETH/USD – Bulls Battle To Remain Above .382 Fib & 20-days MA Support
Key Support Levels: $2162, $2100, $2000.
Key Resistance Levels: $2300, $2400, $2517.
Etheruem is currently down 14.5% from the highs at $2517 set last week. The cryptocurrency had met resistance at a 1.618 Fib Extension level as it started to drop. The crash seen on Sunday caused ETH to dip as low as $1925, where it found support at a .618 Fib Retracement level. It recovered quickly from there to close the daily candle above $2200.
Yesterday, ETH fell again but managed to find support at $2162 (.382 Fib), where it closed the daily candle. The 20-days MA support further bolsters this level. Today, ETH is battling to remain above it as it looks to break above $2200.
ETH-USD Short Term Price Prediction
Looking ahead, the first support lies at $2162 (.382 Fib & 20-days MA). This is followed by $2100, $2000, and $1925 (.618 Fib & 50-days MA).
On the other side, the first resistance lies at $2300. This is followed by $2400 (1.414 Fib Extension – orange), $2517 (1.618 Fib Extension – blue), $2600, and $2680 (1.618 Fib Extension – orange).
The RSI recently dipped beneath the midline but is attempting to return to it today. The break beneath the midline indicates the previous bullish momentum has completely left the market. It would need to climb back above the 50 level for the bulls to gain momentum again.
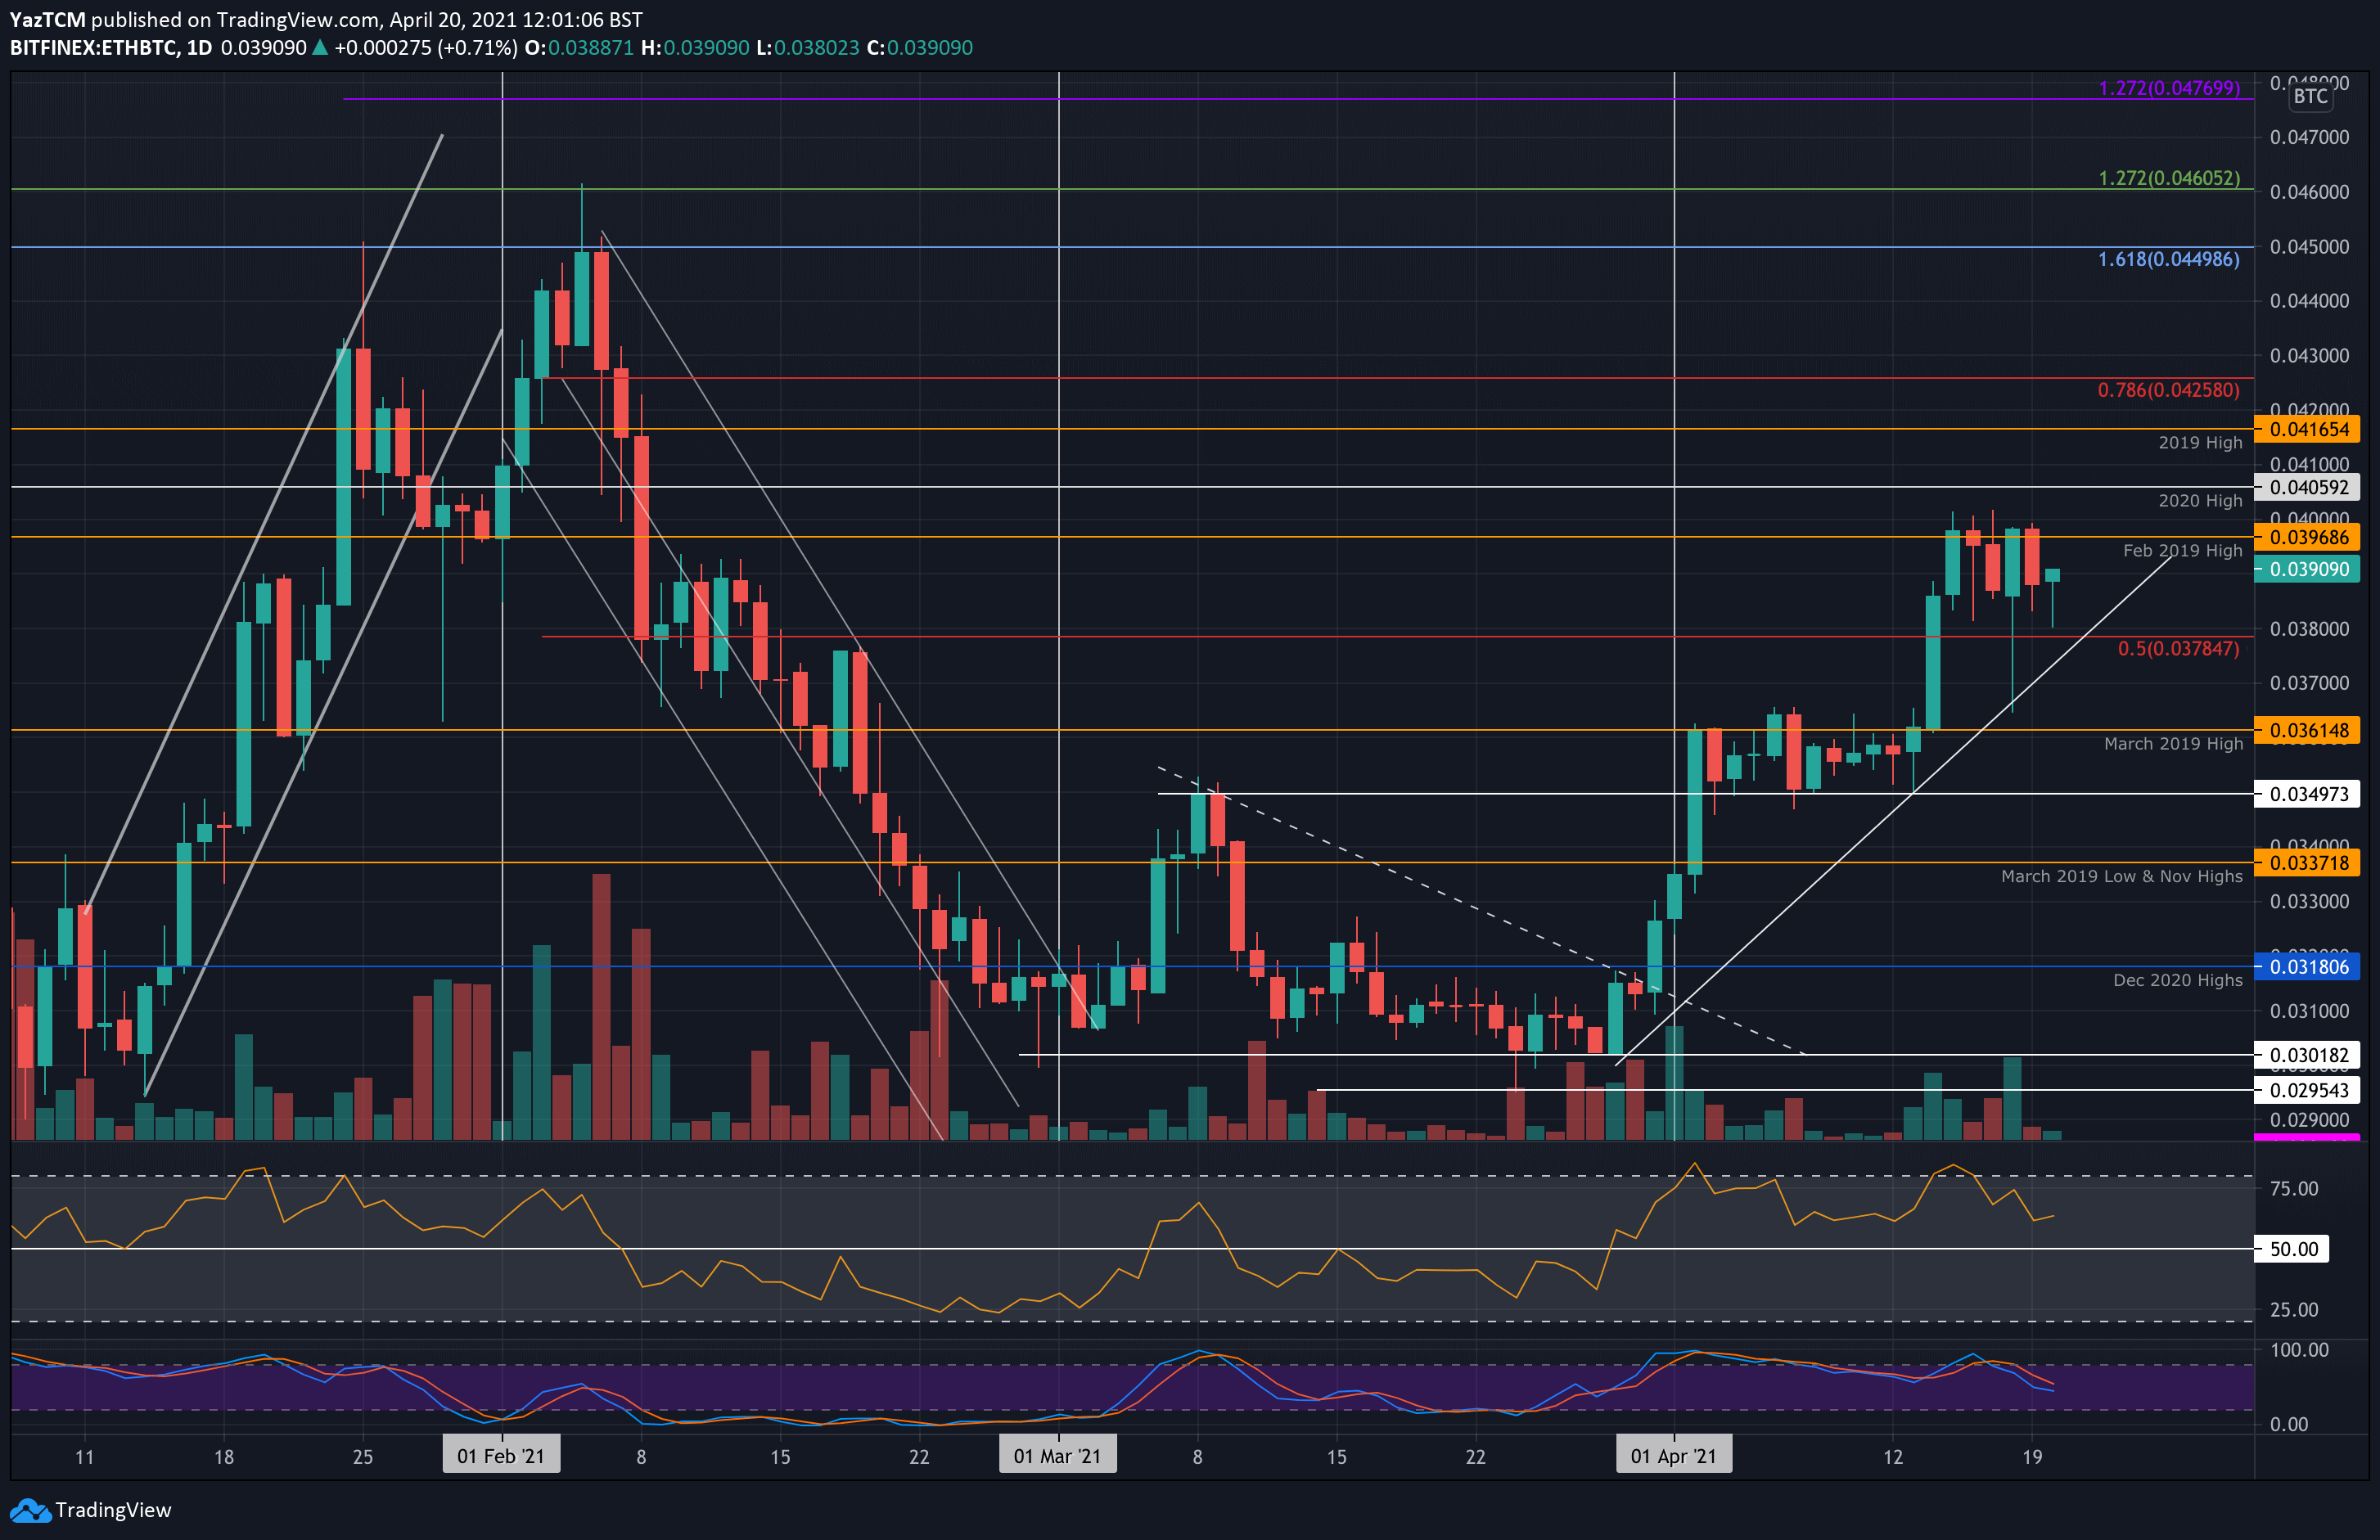
ETH/BTC – Market Sees Rangebound Price Action
Key Support Levels: 0.0385 BTC, 0.038 BTC, 0.037 BTC.
Key Resistance Levels: 0.04 BTC, 0.0406 BTC, 0.0416 BTC.
Ethereum is performing relatively well against Bitcoin itself. Last week, it set a new 2021 high at 0.04 BTC but could not push much higher than that. The flash crash on Sunday caused ETH to fall as low as 0.0366 BTC but it quickly recovered to close the day near 0.04 BTC.
Over the past six days, Ethereum has established a solid trading range between 0.0385 BTC and 0.04 BTC and a closing candle outside of this range should dictate the next direction.
ETH-BTC Short Term Price Prediction
Looking ahead, if the buyers push higher, the first resistance lies at 0.04 BTC. This is followed by 0.0406 BTC (2020 High), 0.0416 BTC (2019 High), and 0.0425 BTC (bearish .786 Fib).
On the other side, the first support lies at 0.0385 BTC. This is followed by 0.038 BTC, 0.037 BTC, and 0.0361 BTC (March 2019 High).
The RSI is in the bull’s favor as it sits above 50. However, it is starting to fall and showing signs of divergence between price action. This could be a signal for an imminent price drop incoming.