ETH/USD – Ethereum Pulls Back From $620 Resistance
Key Support Levels: $580, $560, $550.
Key Resistance Levels: $600, $620, $650.
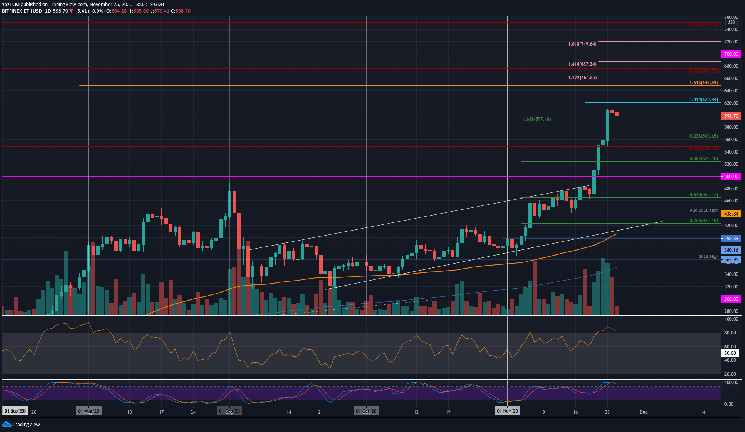
Ethereum cooled off from the 33% price hike it witnessed over the past week, which allowed the coin to break $600 and surge as high as $620. There, it ran into resistance at a 1.414 Fib Extension and was unable to penetrate above it.
ETH has since dropped slightly to trade near the $600 level. The buyers are attempting to defend $600. However, a pullback looks likely.
ETH-USD Short Term Price Prediction
Looking ahead, if the sellers continue beneath $597, the first level of support lies at $580. Beneath this, additional support is located at $560 (.236 Fib), $550, and $524 (.382 Fib). This is followed by resistance at $500.
On the other side, if the bulls climb back above $600, the first level of resistance lies at $620. Above this, resistance is expected at $650, $665, and $675 (bearish .786 Fib Retracement).
The RSI is starting to head lower from extremely overbought conditions, suggesting that the buying momentum is starting to fade slightly. Additionally, the Stochastic RSI has produced a bearish crossover signal.
ETH/BTC – Bulls Reverse From 0.033 BTC.
Key Support Levels: 0.0305 BTC, 0.03 BTC, 0.0294 BTC.
Key Resistance Levels: 0.032 BTC, 0.033 BTC, 0.0337 BTC.
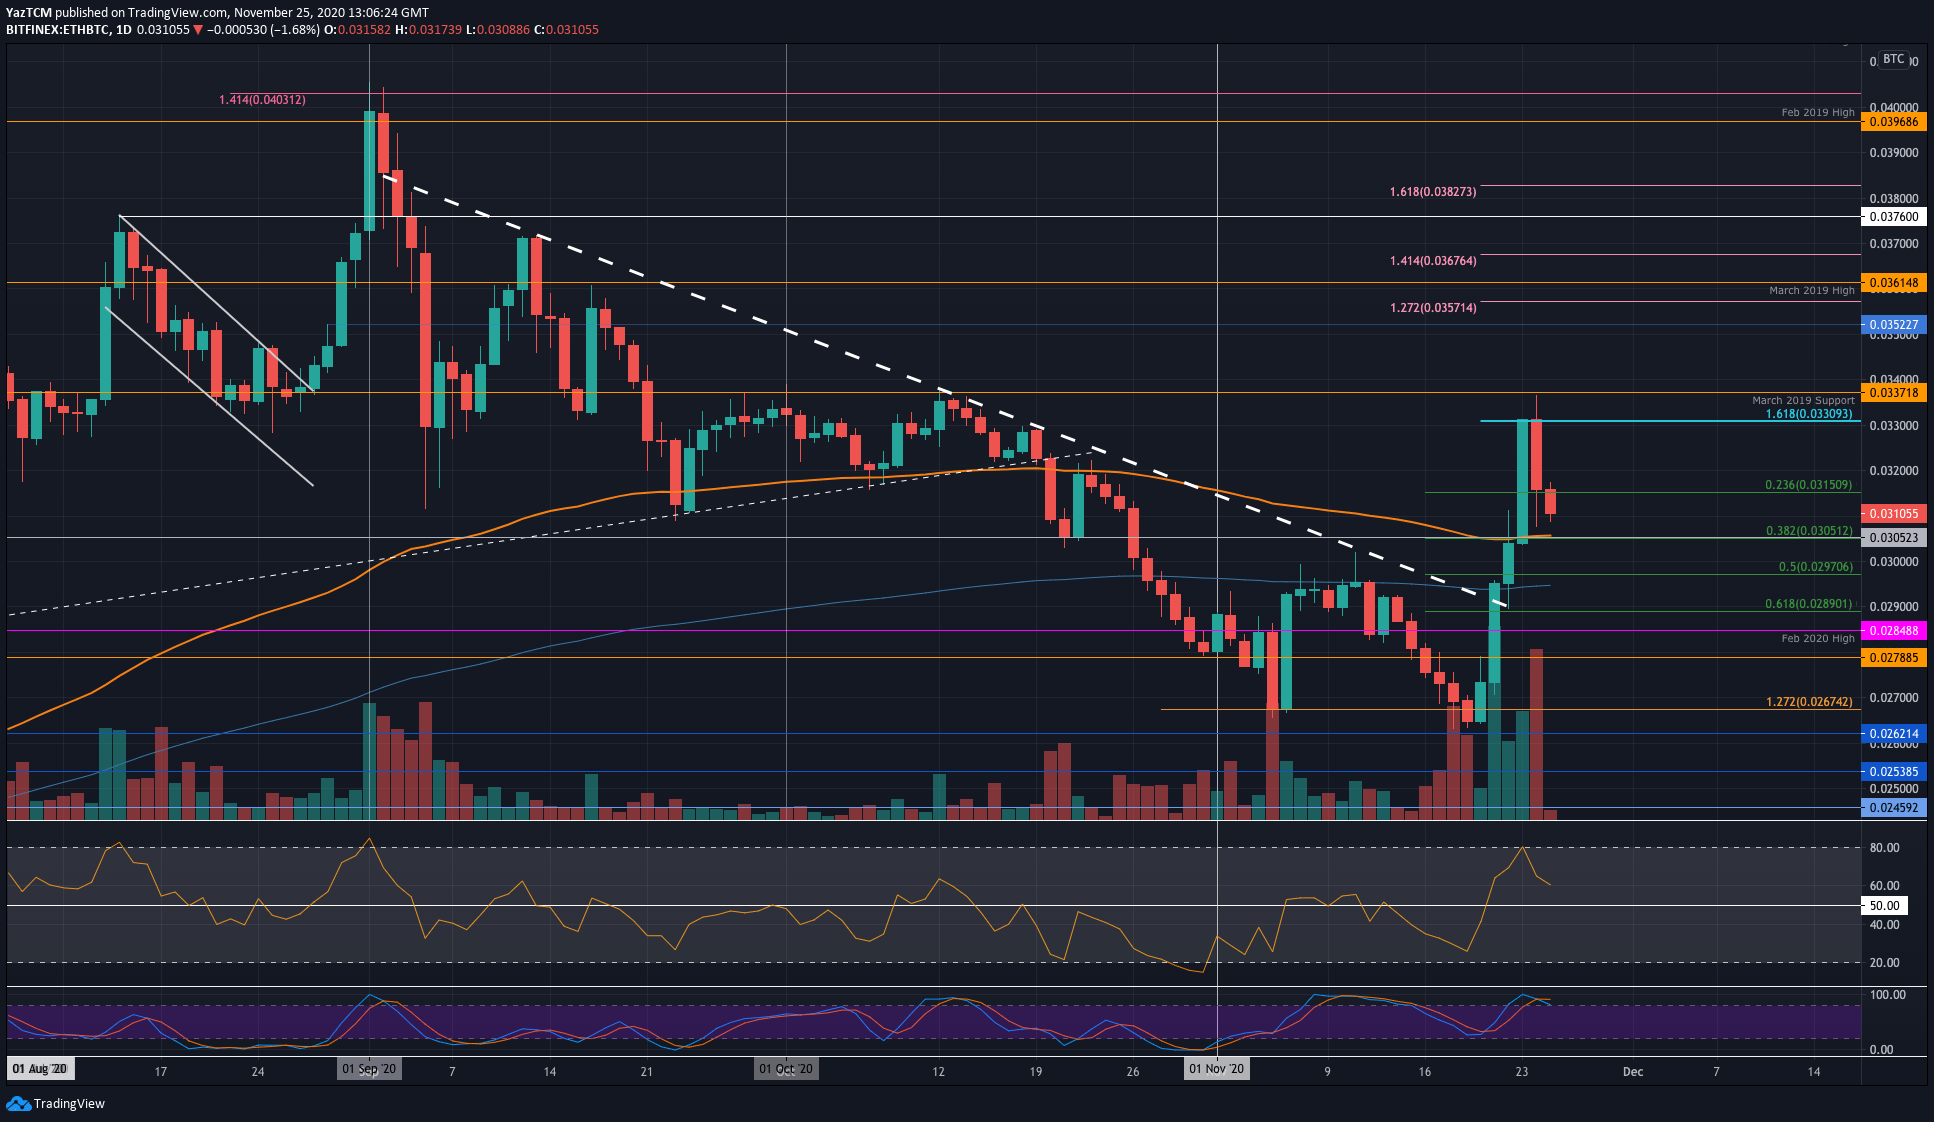
Against Bitcoin, Ethereum also pushed higher this week to meet the resistance at 0.033 BTC (1.618 Fib Extension). Yesterday, the coin spiked higher to hit 0.0337 BTC (March 2019 Support), but the sellers quickly pushed it lower to close the daily candle at 0.033 BTC.
It has since rolled over and headed lower. Today, ETH fell beneath the support at 0.0315 BTC (.236 Fib) and is now trading at 0.031 BTC.
ETH-BTC Short Term Price Prediction
Looking ahead, if the sellers continue to head lower, the first level of support lies at 0.0305 BTC (.382 Fib & 100-days EMA). Beneath this, support is located at 0.03 BTC, 0.0294 BTC (200-days EMA), and 0.0289 BTC (.618 Fib).
On the other side, the first level of resistance lies at 0.032 BTC. Above this, resistance is expected at 0.033 BTC (1.618 Fib Extension), 0.0337 BTC (March 2019 support), and 0.035 BTC.
Likewise, the RSI has pulled back from overbought conditions as the bulls start to lose their momentum, and the Stochastic RSI produced a bearish crossover signal.