ETH/USD – Bulls Spike Into Bearish .5 Fib Retracement.
Key Support Levels: $376, $364, $356.
Key Resistance Levels: $396, $400, $410.
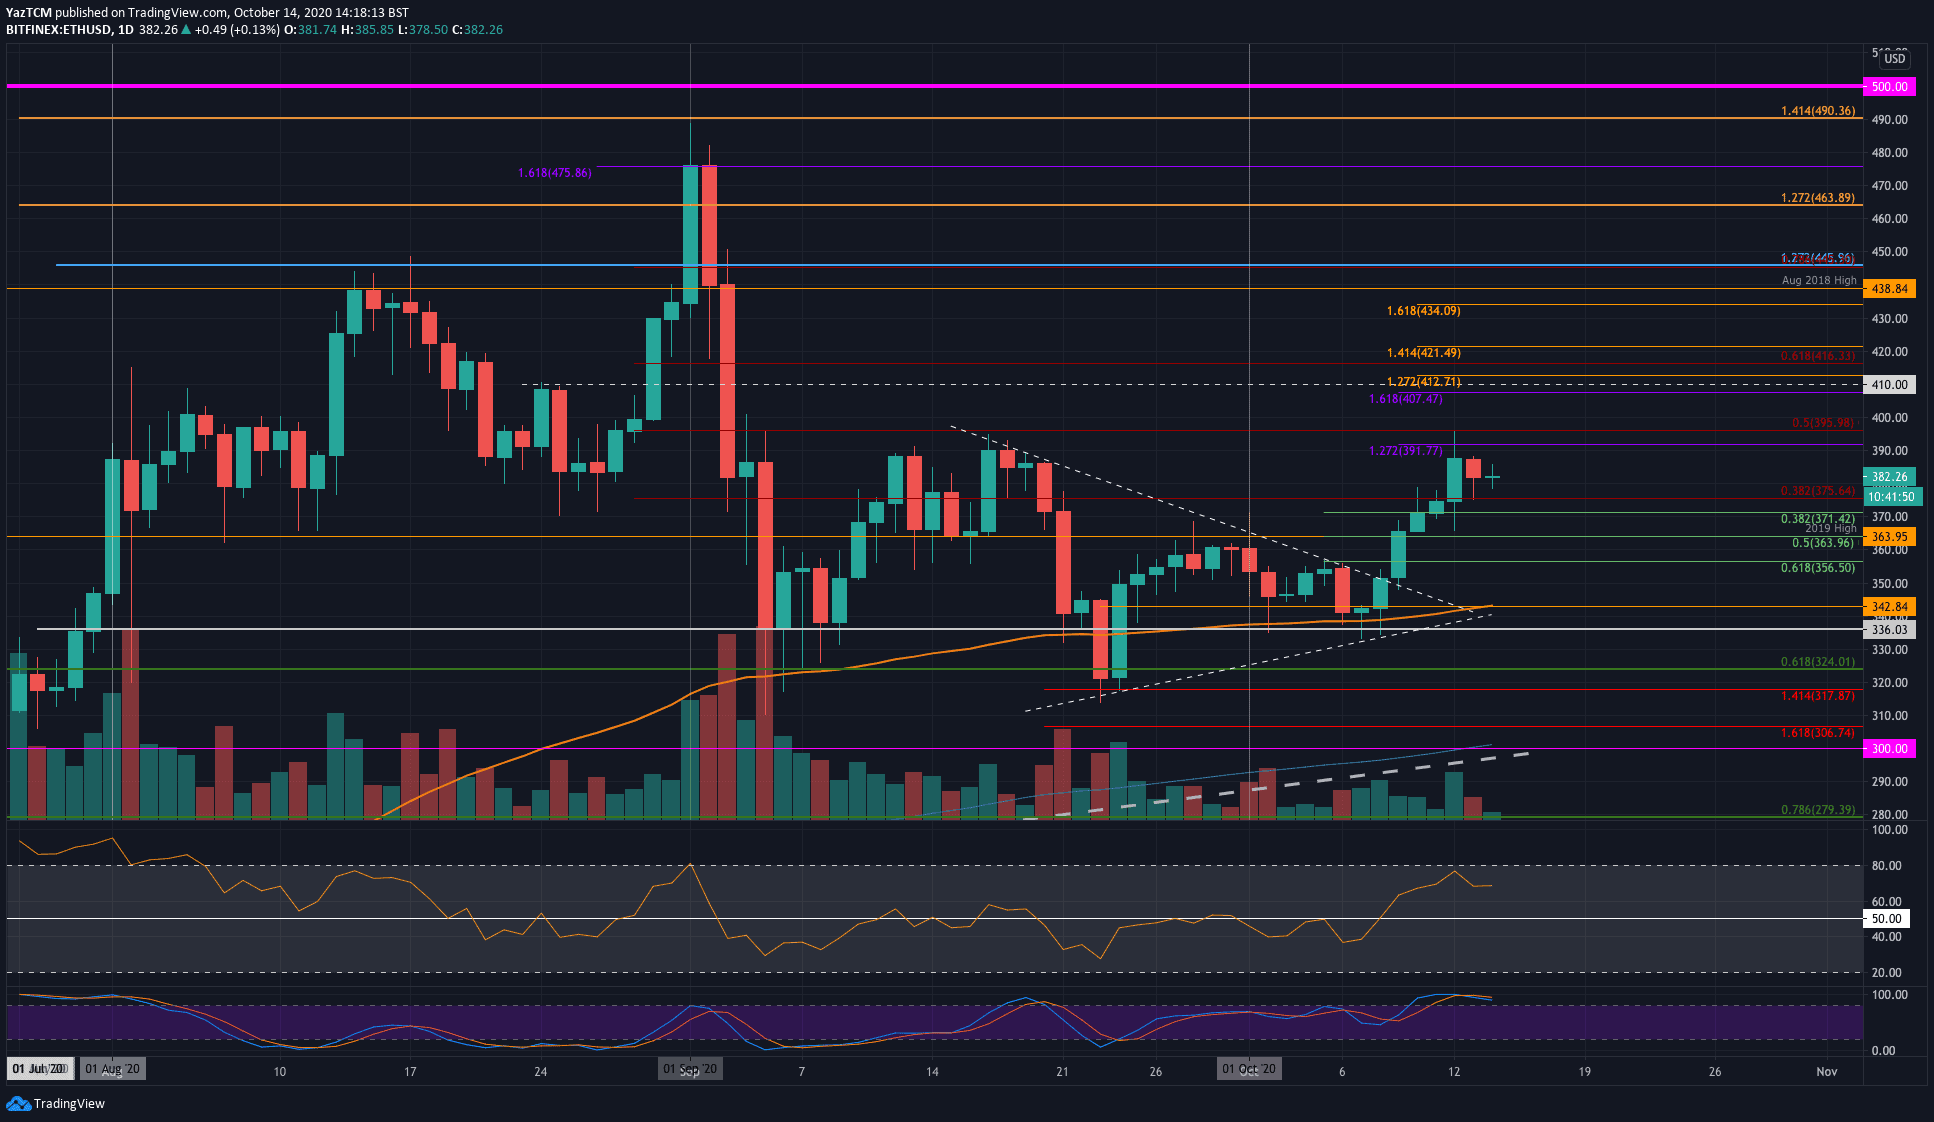
Ethereum has been on a bullish footing since breaking out of the consolidation phase last week. Over the past seven days, Ethereum managed to rise by a total of 12% to reach the current level.
It had surged higher at the start of this week as it reached as high as $396, where it ran into resistance at a bearish .5 Fib Retracement level. It has since dropped lower but is supported by the previous resistance at $375.
ETH-USD Short Term Price Prediction
Looking ahead, if the bulls regroup and start to push higher again, the first level of resistance lies at $390. This is followed by resistance at $396 (bearish .5 Fib), $400, and $410. Added resistance lies at $416 (bearish .618 Fib) and $421.
On the other side, the first level of support lies at $375. This is quickly followed by support at $371 (.382 Fib), $364 (2019 High), and $356 (.618 Fib). Added support is found at $350 and $343 (100-days EMA).
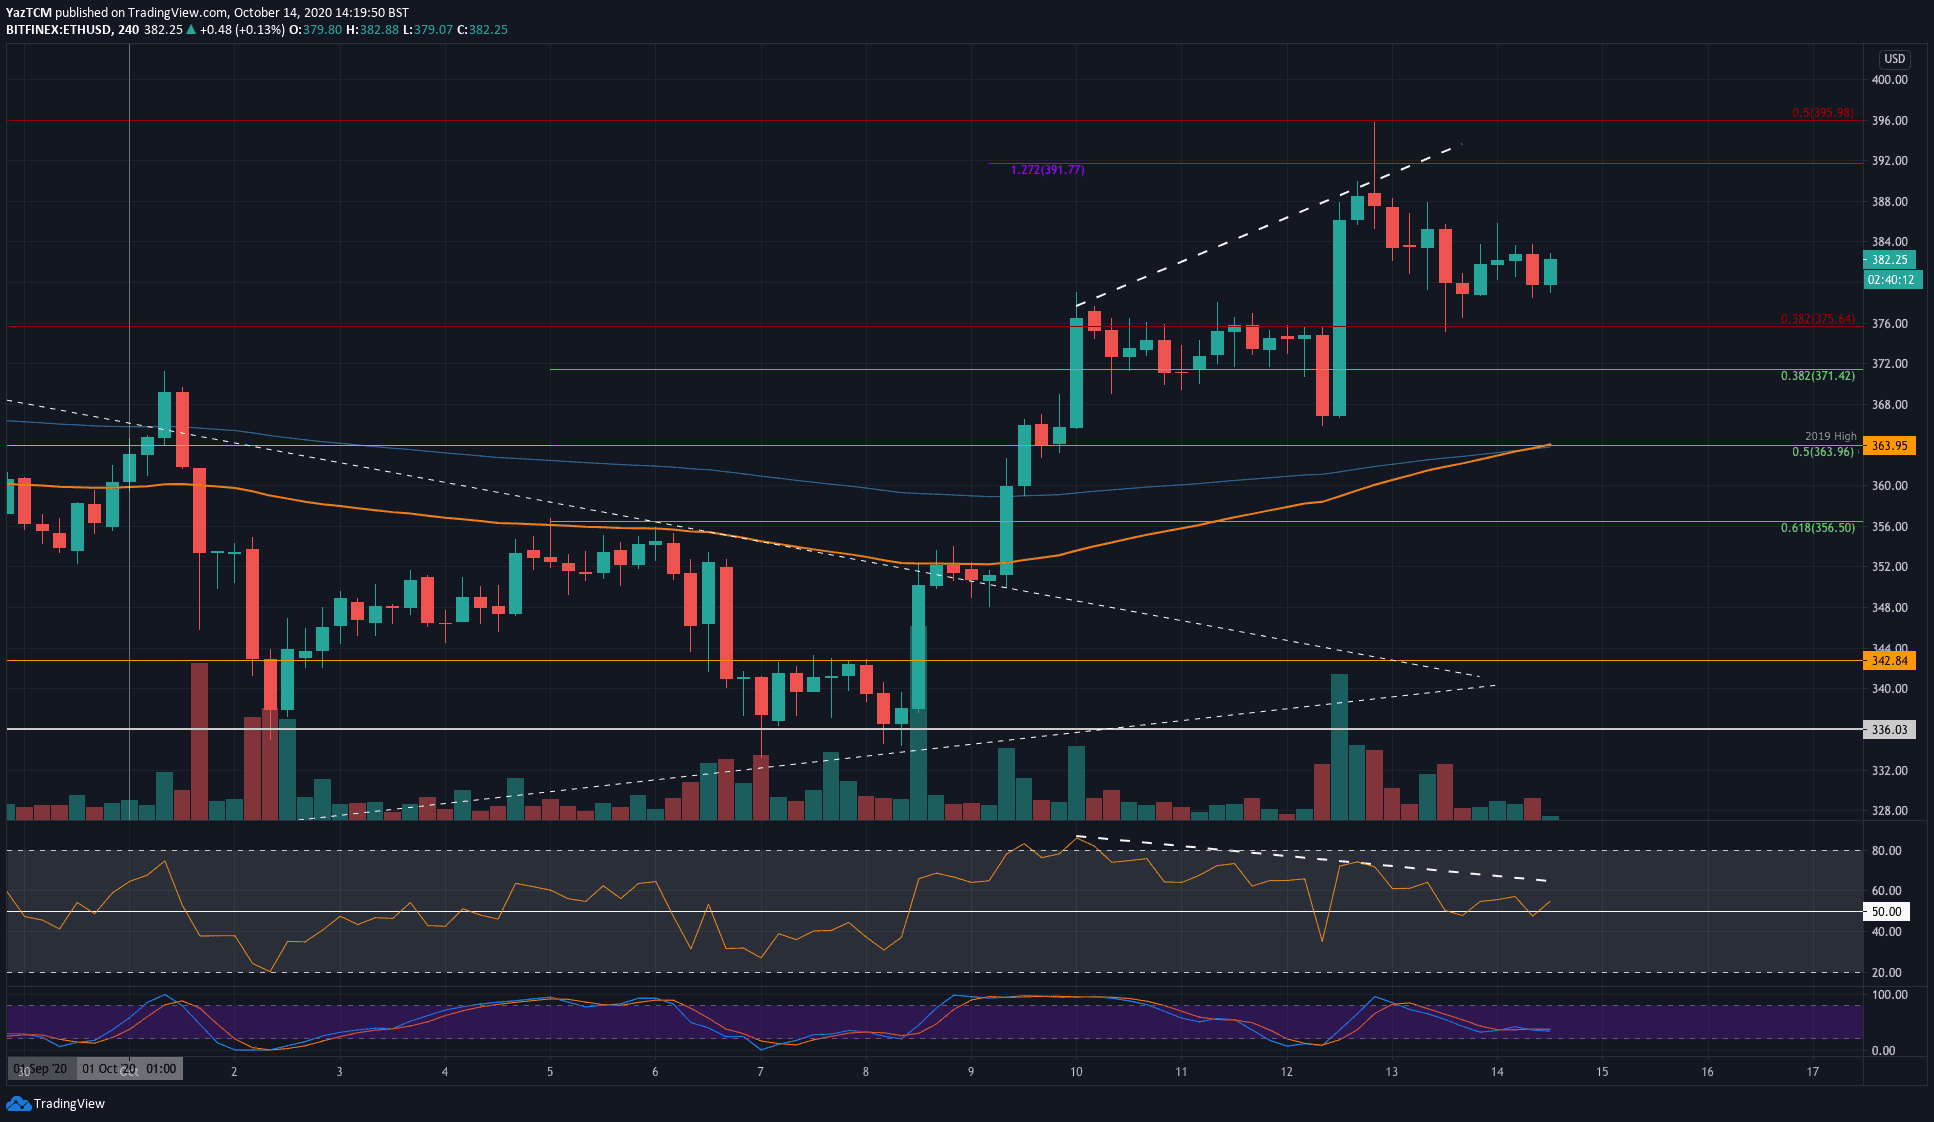
On the daily chart, the Stochastic RSI is overbought and ready for a bearish crossover signal. However, on the following 4HR chart, the RSI is showing signs of bearish divergence as the RSI makes lower lows while the price makes higher highs;
ETH/BTC – Ethereum Bulls Stall at March 2019 Support (now Resistance).
Key Support Levels: 0.0332 BTC, 0.0327 BTC, 0.032 BTC.
Key Resistance Levels: 0.0337 BTC, 0.034 BTC, 0.0347 BTC.
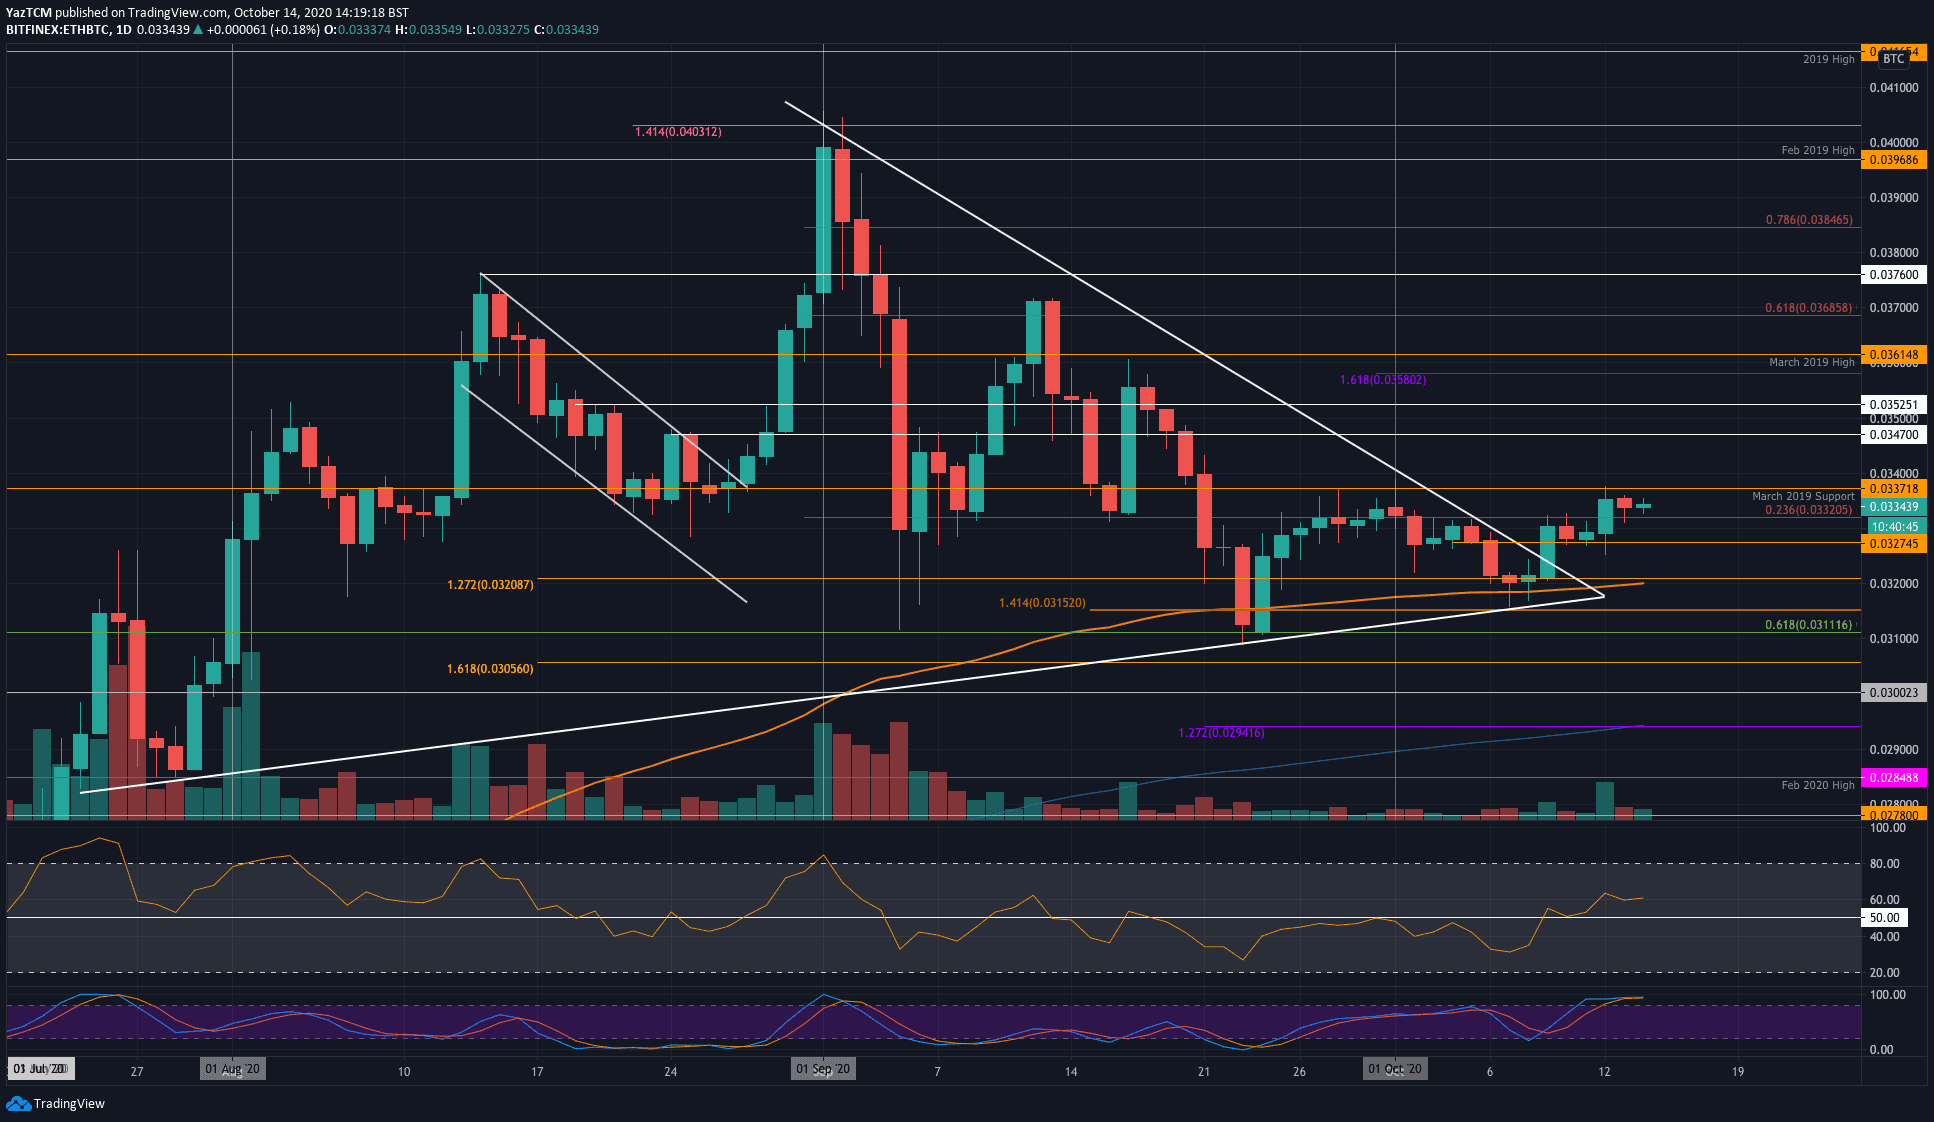
Against Bitcoin, Ethereum managed to break a month-old falling trend line last week. After breaking above, it initially found resistance at a bearish .236 Fib Retracement at 0.0332 BTC.
The buyers managed to break this level of resistance at the start of the week as they surged into the higher resistance at 0.0337 BTC – provided by the March 2019 support (now turned resistance).
ETH-BTC Short Term Price Prediction
Looking ahead, the bulls need to break 0.0337 BTC and 0.034 BTC to kick-start a short term bull run. Beyond 0.034 BTC, resistance lies at 0.0347 BTC and 0.0352 BTC.
On the other side, the first level of support lies at 0.0332 BTC. Beneath 0.033 BTC, additional support is found at 0.0327 BTC and 0.032 BTC (100-days EMA).
The RSI is above the mid-line to indicate bullish momentum; however, the Stochastic RSI is already overbought and is primed for a bearish crossover signal.