- Ethereum fell by a precipitous 10% today as it slips to $336.
- The cryptocurrency failed to surpass the $390 resistance last week and fell today as BTC dropped by 3%.
- Against Bitcoin, ETH also fell by 5.3% as it penetrated beneath the crucial support at 0.0329 BTC to trade at 0.032 BTC.
ETH/USD – Etheruem Bears Return Market To September Support
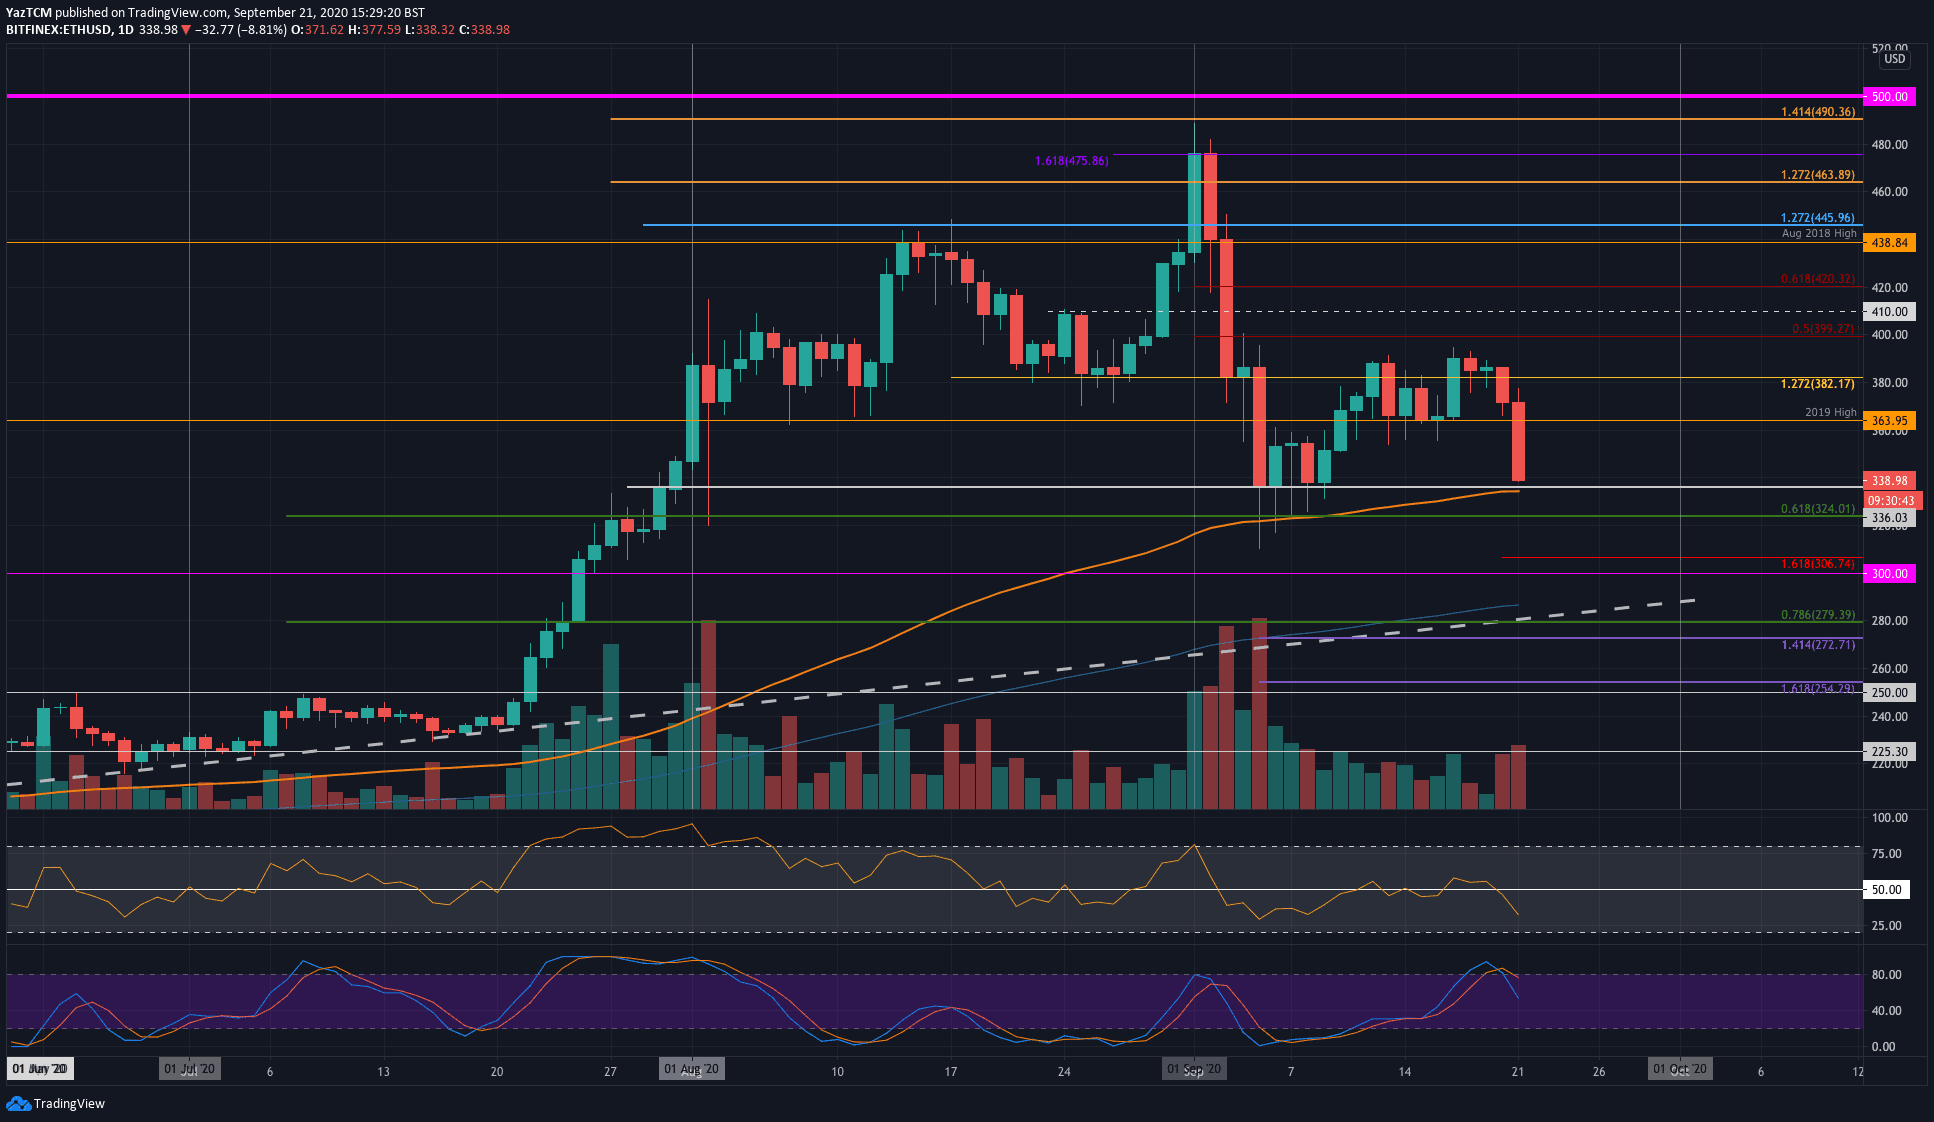
Key Support Levels: $336, $325, $306.
Key Resistance Levels: $364, $380, $390.
Ethereum fell by a steep 10% today as it dropped beneath $364 (2019 High) to about $336. Toward the end of last week, Ethereum had reached the $390 resistance but could not penetrate above there, which led to ETH rolling over.
Luckily, there is strong support at the $336 level that held the market during the early September drops. A daily closing candle beneath here could spell disaster for Ethereum as it could head lower toward $300.
ETH-USD Short Term Price Prediction
Looking ahead, the first level of strong support lies at $336. The 100-days further bolster this support EMA. Beneath this, additional support lies at $325 (.618 Fib Retracement), $306 (downside 1.618 Fib Extension), and $300.
On the other side, the first level of resistance now lies at $364 (2019 Highs). Above this, resistance lies at $380, $390, and $400.
The RSI recently penetrated beneath the mid-line to indicate increased bearish momentum within the market. In addition to this, the Stochastic RSI also produced a bearish crossover signal, which, when combined with the falling RSI, is not a pretty sight for any bulls right now.
ETH/BTC – Bears Break Through Strong September Support
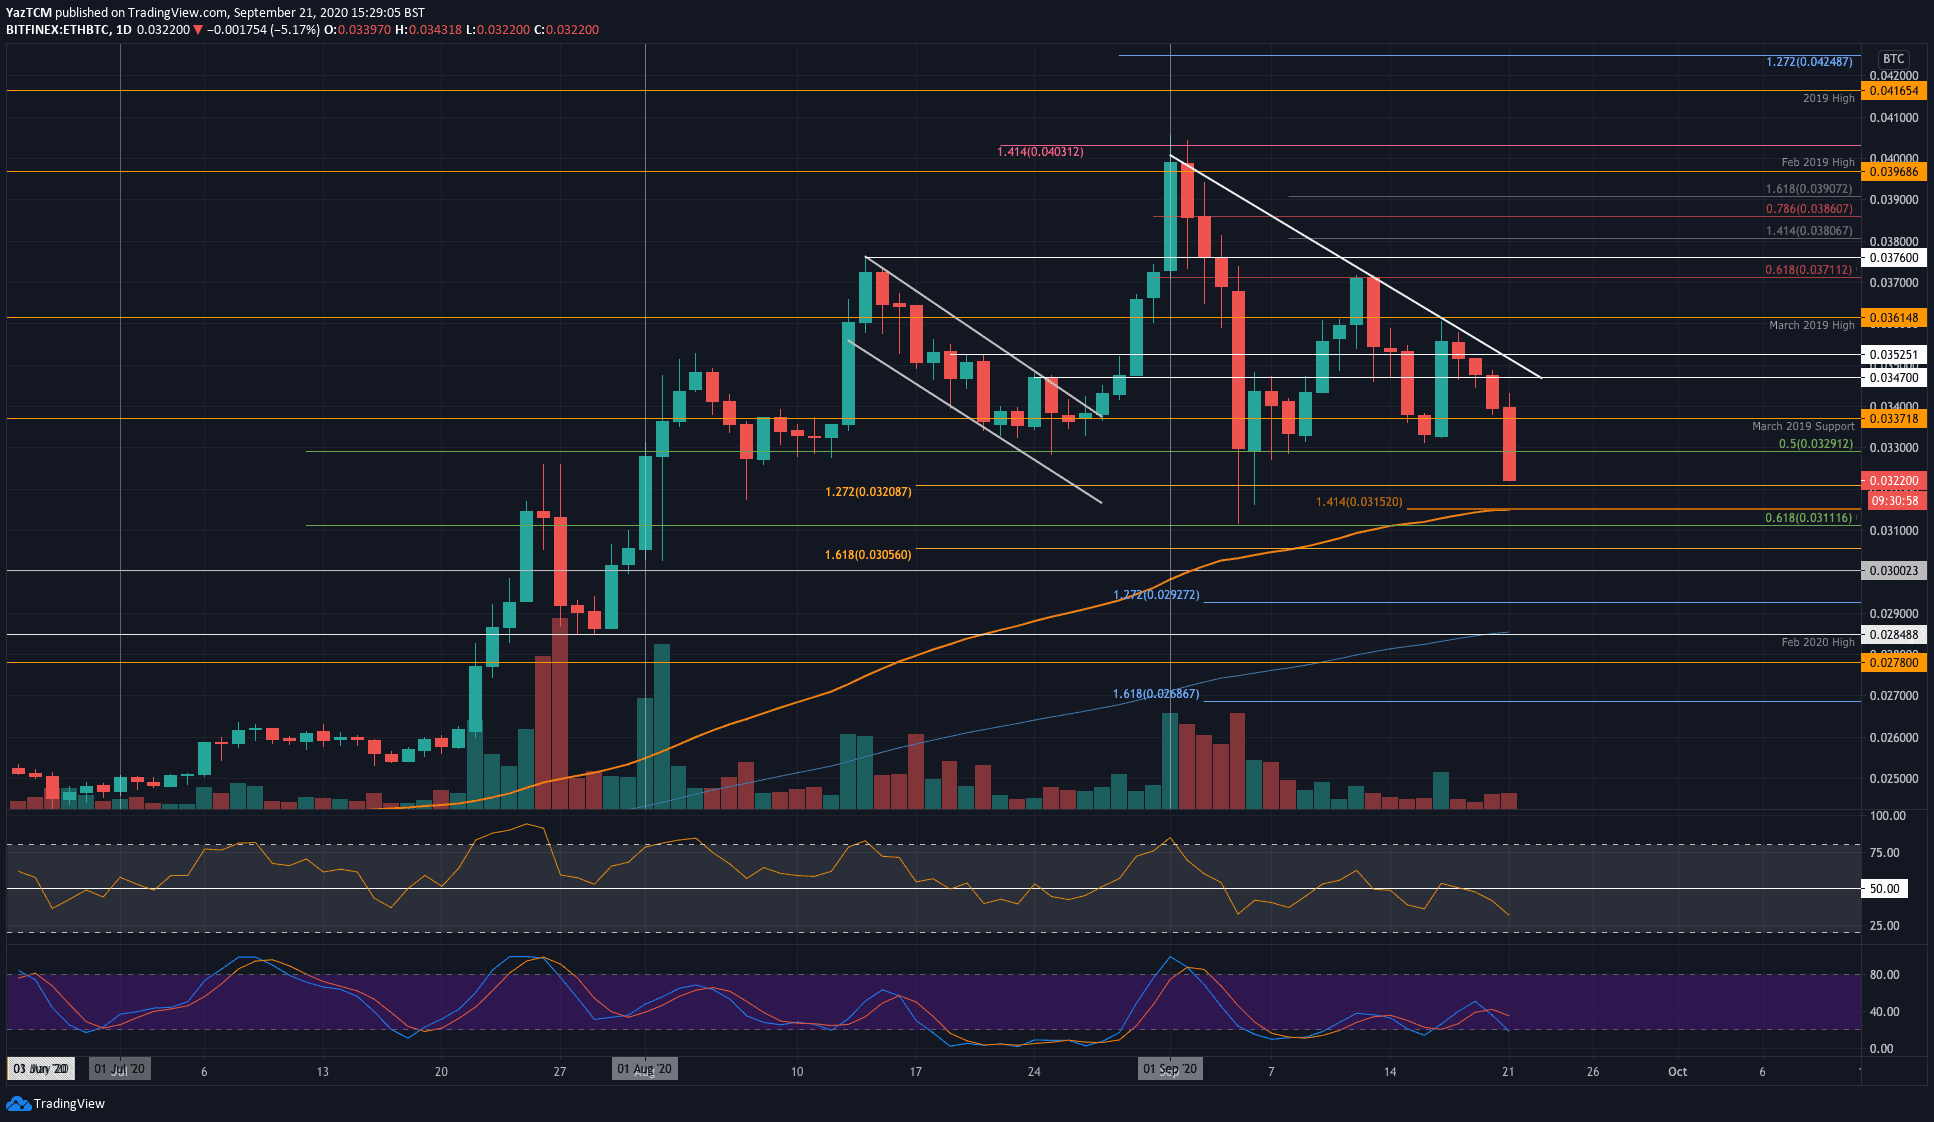
Key Support Levels: 0.032 BTC, 0.0315 BTC, 0.0311 BTC.
Key Resistance Levels: 0.0329 BTC, 0.0337 BTC, 0.0347 BTC
The situation is relatively similar for ETH against Bitcoin. The market had reached resistance at a falling trend line last week and failed to break above it. From there, the coin started to head lower throughout the weekend to hit 0.0337 BTC (March 2019 support) yesterday.
Today, Ethereum continued further as it dropped beneath the strong support at 0.0329 BTC (.5 Fib Retracement). This level had prevented ETH from dropping lower during the early September price drop.
The coin headed beneath the mentioned support and is on the way to hitting 0.032 BTC (downside 1.272 Fib Extension).
ETH-BTC Short Term Price Prediction
Looking ahead, the first level of support lies at 0.032 BTC. This is followed by support at 0.0315 BTC (downside 1.414 Fib extension & 100-days EMA) and 0.0311 BTC (.618 Fib Retracement).
On the other side, the first level of resistance lies at 0.033 BTC. This is followed by resistance at 0.0337 BTC, 0.0347 BTC, and 0.0352 BTC.
Likewise, the RSI dipped back beneath the mid-line this weekend to indicate increased bearish momentum.