- Ethereum saw a sharp 5.6% price fall this past week as it drops to $223.
- This has caused ETH to penetrate beneath a rising trend line that has been in play since mid-March 2020.
- Against Bitcoin, Ethereum failed to overcome 0.0253 BTC again and dropped to 0.0245 BTC.
Key Support & Resistance Levels
ETH/USD:
Support: $215, $210, $200.
Resistance: $225, $245, $250.
ETH/BTC:
Support: 0.0243 BTC, 0.0239 BTC, 0.0236 BTC.
Resistance: 0.025 BTC, 0.0253 BTC, 0.026 BTC.
ETH/USD: Ethereum Falls Beneath Rising Trend Line.
Ethereum tested the resistance at $250 last week, but it failed to overcome it. This caused ETH to drop lower as it fell beneath the rising trend line support and fell as low as $215 (.236 Fib Retracement) during the week.
ETH has rebounded from $215 as it trades at $223. However, the break beneath the rising trend line is quite significant as it could potentially mark a major shift in the trend if ETH continues to drop further beneath $200 (200-day EMA).
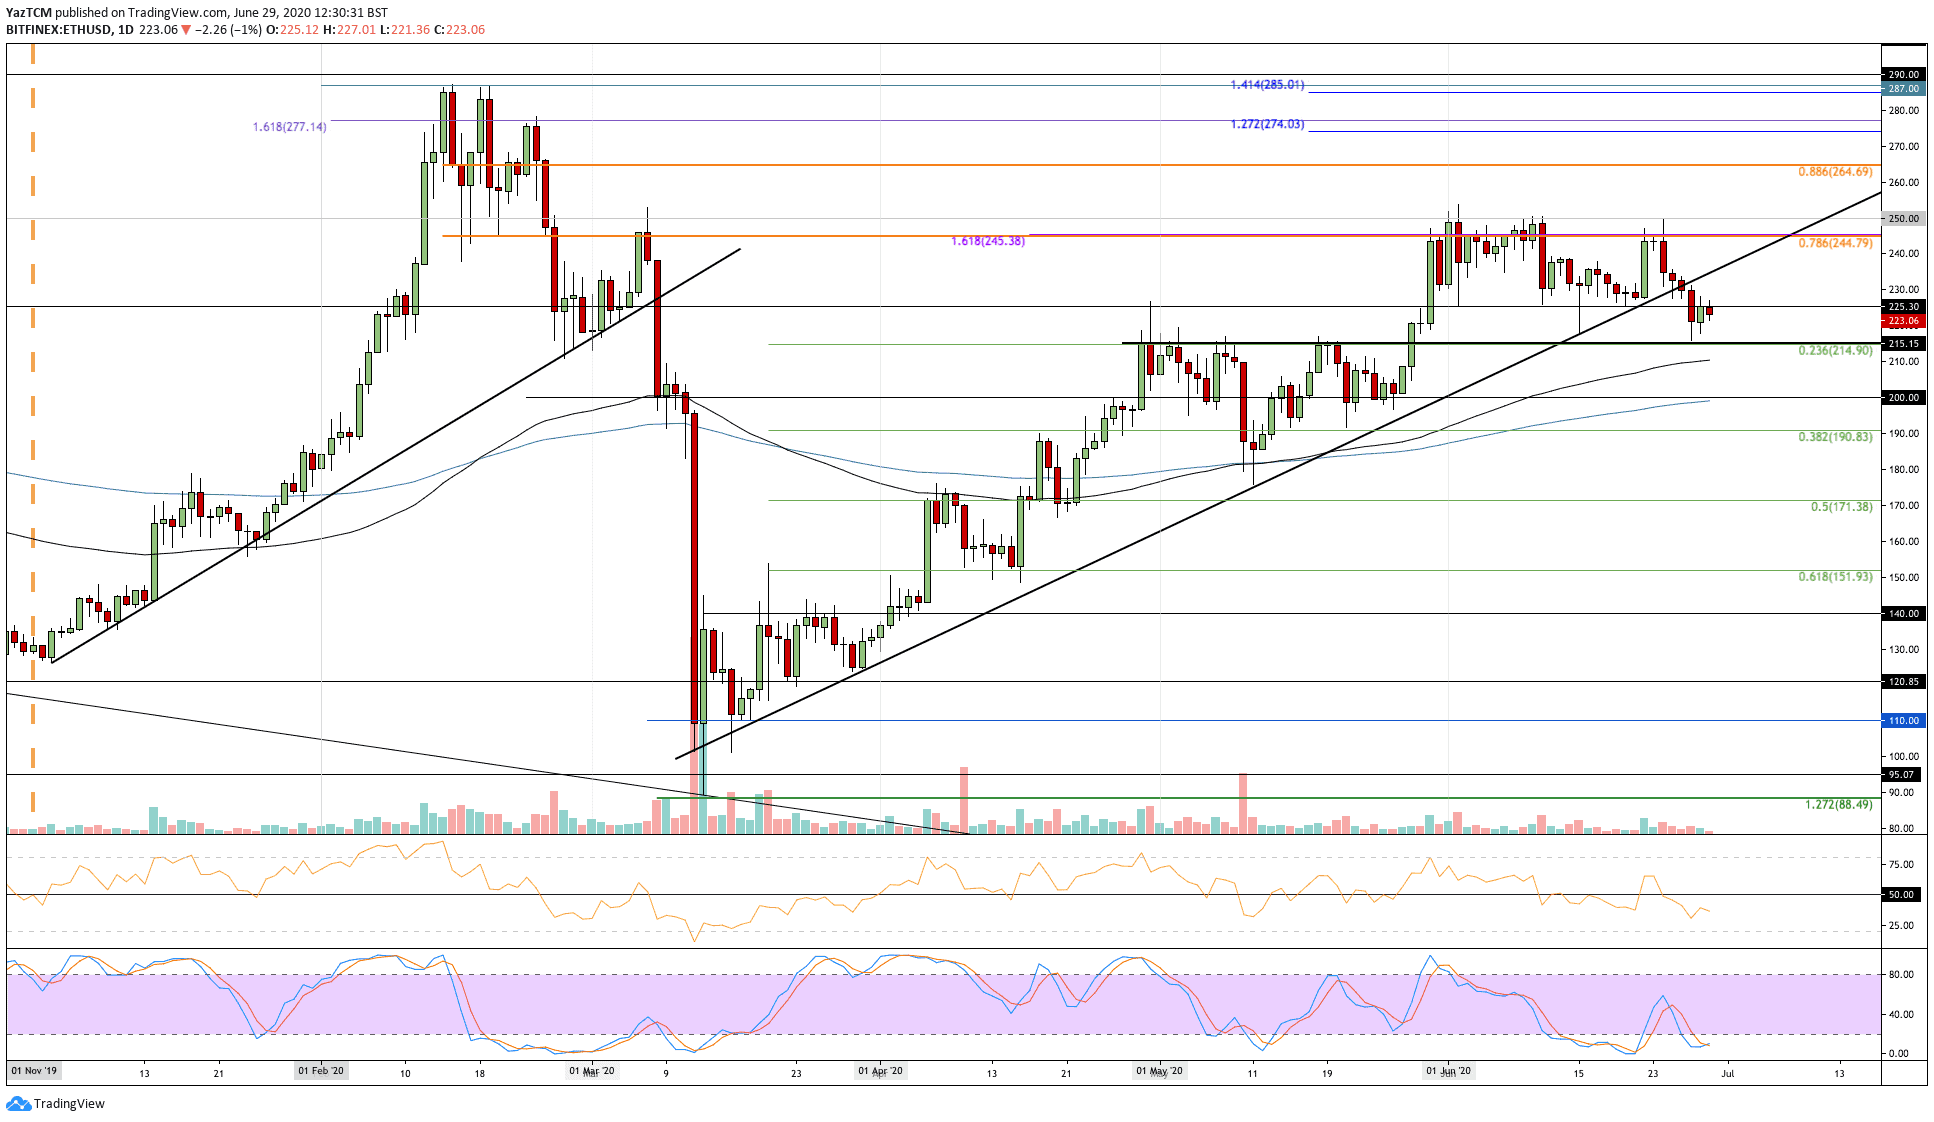
ETH-USD Short Term Price Prediction
Looking ahead, if the bears push lower, the first level of support lies at $215 (.236 Fib Retracement). This is followed by additional support at $210 (100-day EMA), $200 (200-day EMA), and $190 (.382 Fib Retracement).
On the other side, the first level of resistance lies at $225. Above this, resistance is expected at $245 (bearish .786 Fib Retracement), $250, and $265 (bearish .886 Fib Retracement).
The RSI has dipped beneath the 50 line to show bearish momentum within the market. Luckily, the Stochastic RSI is in oversold conditions and is primed for a bullish crossover signal that should send the market higher.
ETH/BTC: ETH Back At .236 Fib Support
Against Bitcoin, Ethereum attempted to break the strong resistance at 0.0253 BTC last week. This level has caused trouble for ETH during both May and June, and it must be overcome for ETH to travel higher.
This time, ETH was unable to break 0.0253 BTC as it rolled over and headed lower. It dropped beneath 0.025 BTC as it reached the support at 0.0243 BTC (.236 Fib Retracement level).
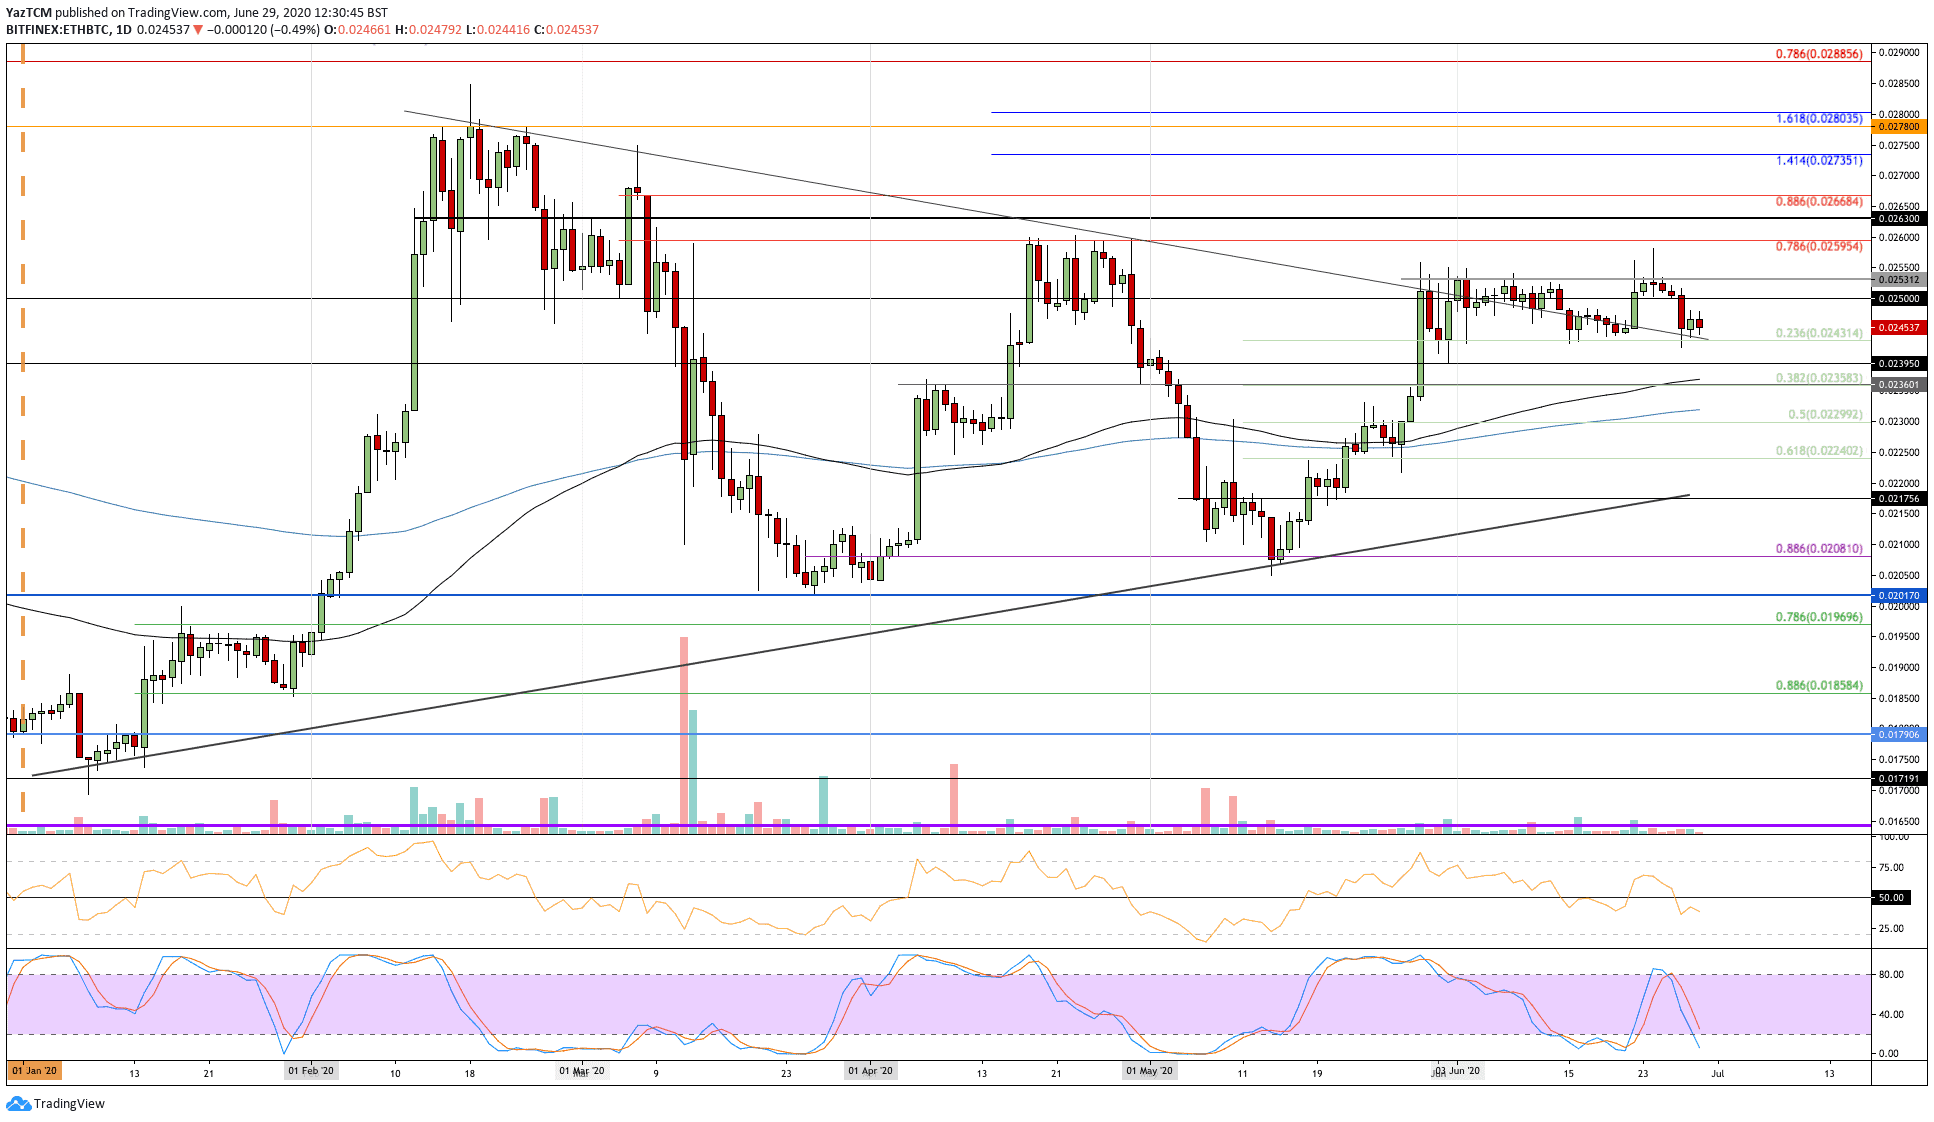
ETH-BTC Short Term Price Prediction
Moving forward, if the sellers do push beneath 0.0243 BTC, the first level of support lies at 0.0239 BTC. This is followed by added support at 0.0236 BTC (100-day EMA & .382 Fib Retracement) and 0.023 BTC (.5 Fib Retracement).
On the other side, the first level of resistance lies at 0.025 BTC. This is followed by resistance at 0.0253 BTC and 0.026 BTC (bearish .786 Fib Retracement).
The RSI has also dipped beneath the 50 line to indicate bearish momentum has taken control of the market. Likewise, the Stochastic RSI is almost ready for a bullish crossover that should help to push the market higher.