- Ethereum attempted to recover this week but only managed to rise by a small 2%.
- The cryptocurrency remains trapped within a symmetrical triangle against Bitcoin.
- Momentum has returned back into the favor of the bears as the coin shapes up for another drop lower.
Key Support & Resistance Levels
ETH/USD
Support: $140, $133.50, $128.35.
Resistance: $158.60, $165, $175, $185.
ETH/BTC:
Support: 0.020 BTC, 0.0196 BTC, 0.0190 BTC
Resistance: 0.0210 BTC, 0.0215 BTC, 0.0223 BTC
ETH/USD – Ethereum Fail To Meet $160 And Falls
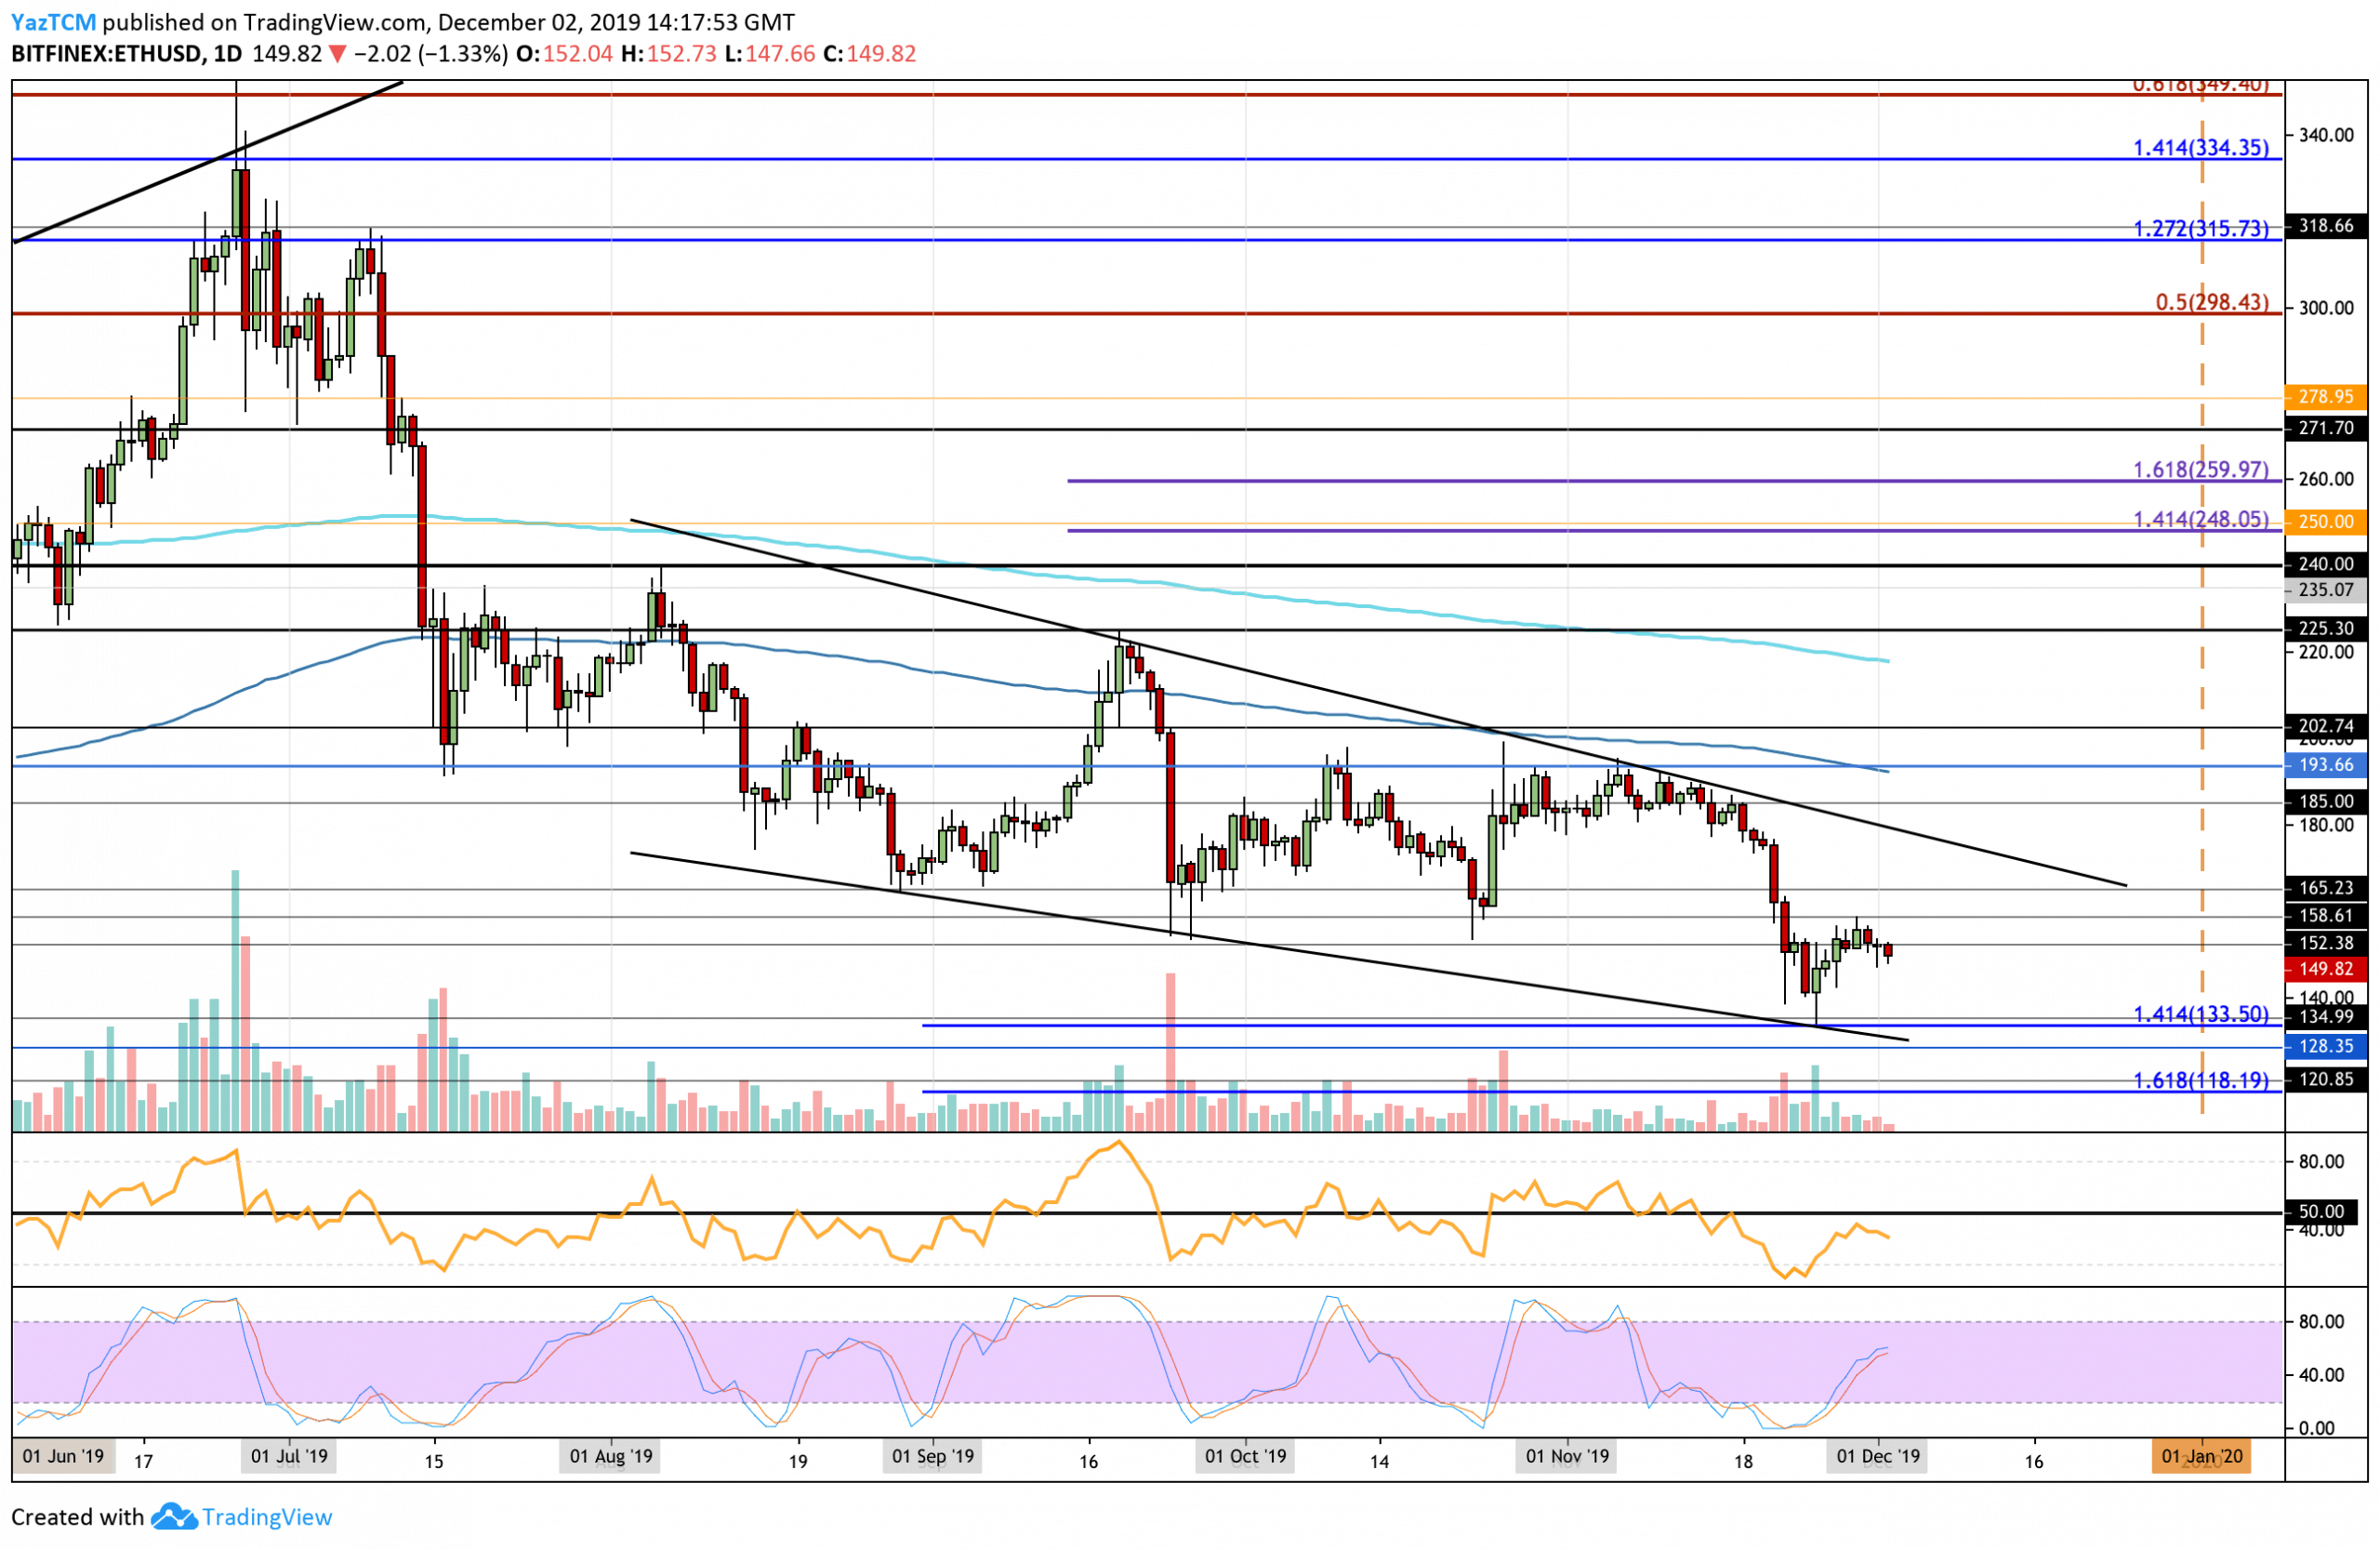
Since our last analysis, Ethereum managed to rebound from the support around $133.50 and successfully climbed back above the $150 level. However, the increase was halted as ETH ran into resistance at the $158.60 level. The coin rolled over from there and started to fall again.
Ethereum decreased below $150 to reach its current trading price at around $149.80 and the trend seems rather bearish. For this to change, we would need to see ETH breaking above the resistance at $194 which is a long way away!
Ethereum Short Term Price Prediction
Ethereum is back on the bearish footing as it looks to head lower. Toward the downside, we can expect immediate support to be located at $140 and then at the October low at around $133.50. If the sellers break beneath the October support, we can expect added support at $130 (lower boundary of descending price channel) and $128.35.
Alternatively, if the bulls can regroup and push higher beyond $150 we can expect immediate resistance to be located at $158.60. Above this, higher resistance lies at $175 (upper boundary of price channel), and $185.
The Stochastic RSI did end up producing a bullish crossover signal, however, this only allowed the market to reach the $158 resistance level. The RSI is back on the downturn as the bears continue to increase their selling pressure.
ETH/BTC – Remains Inside The Symmetrical Triangle
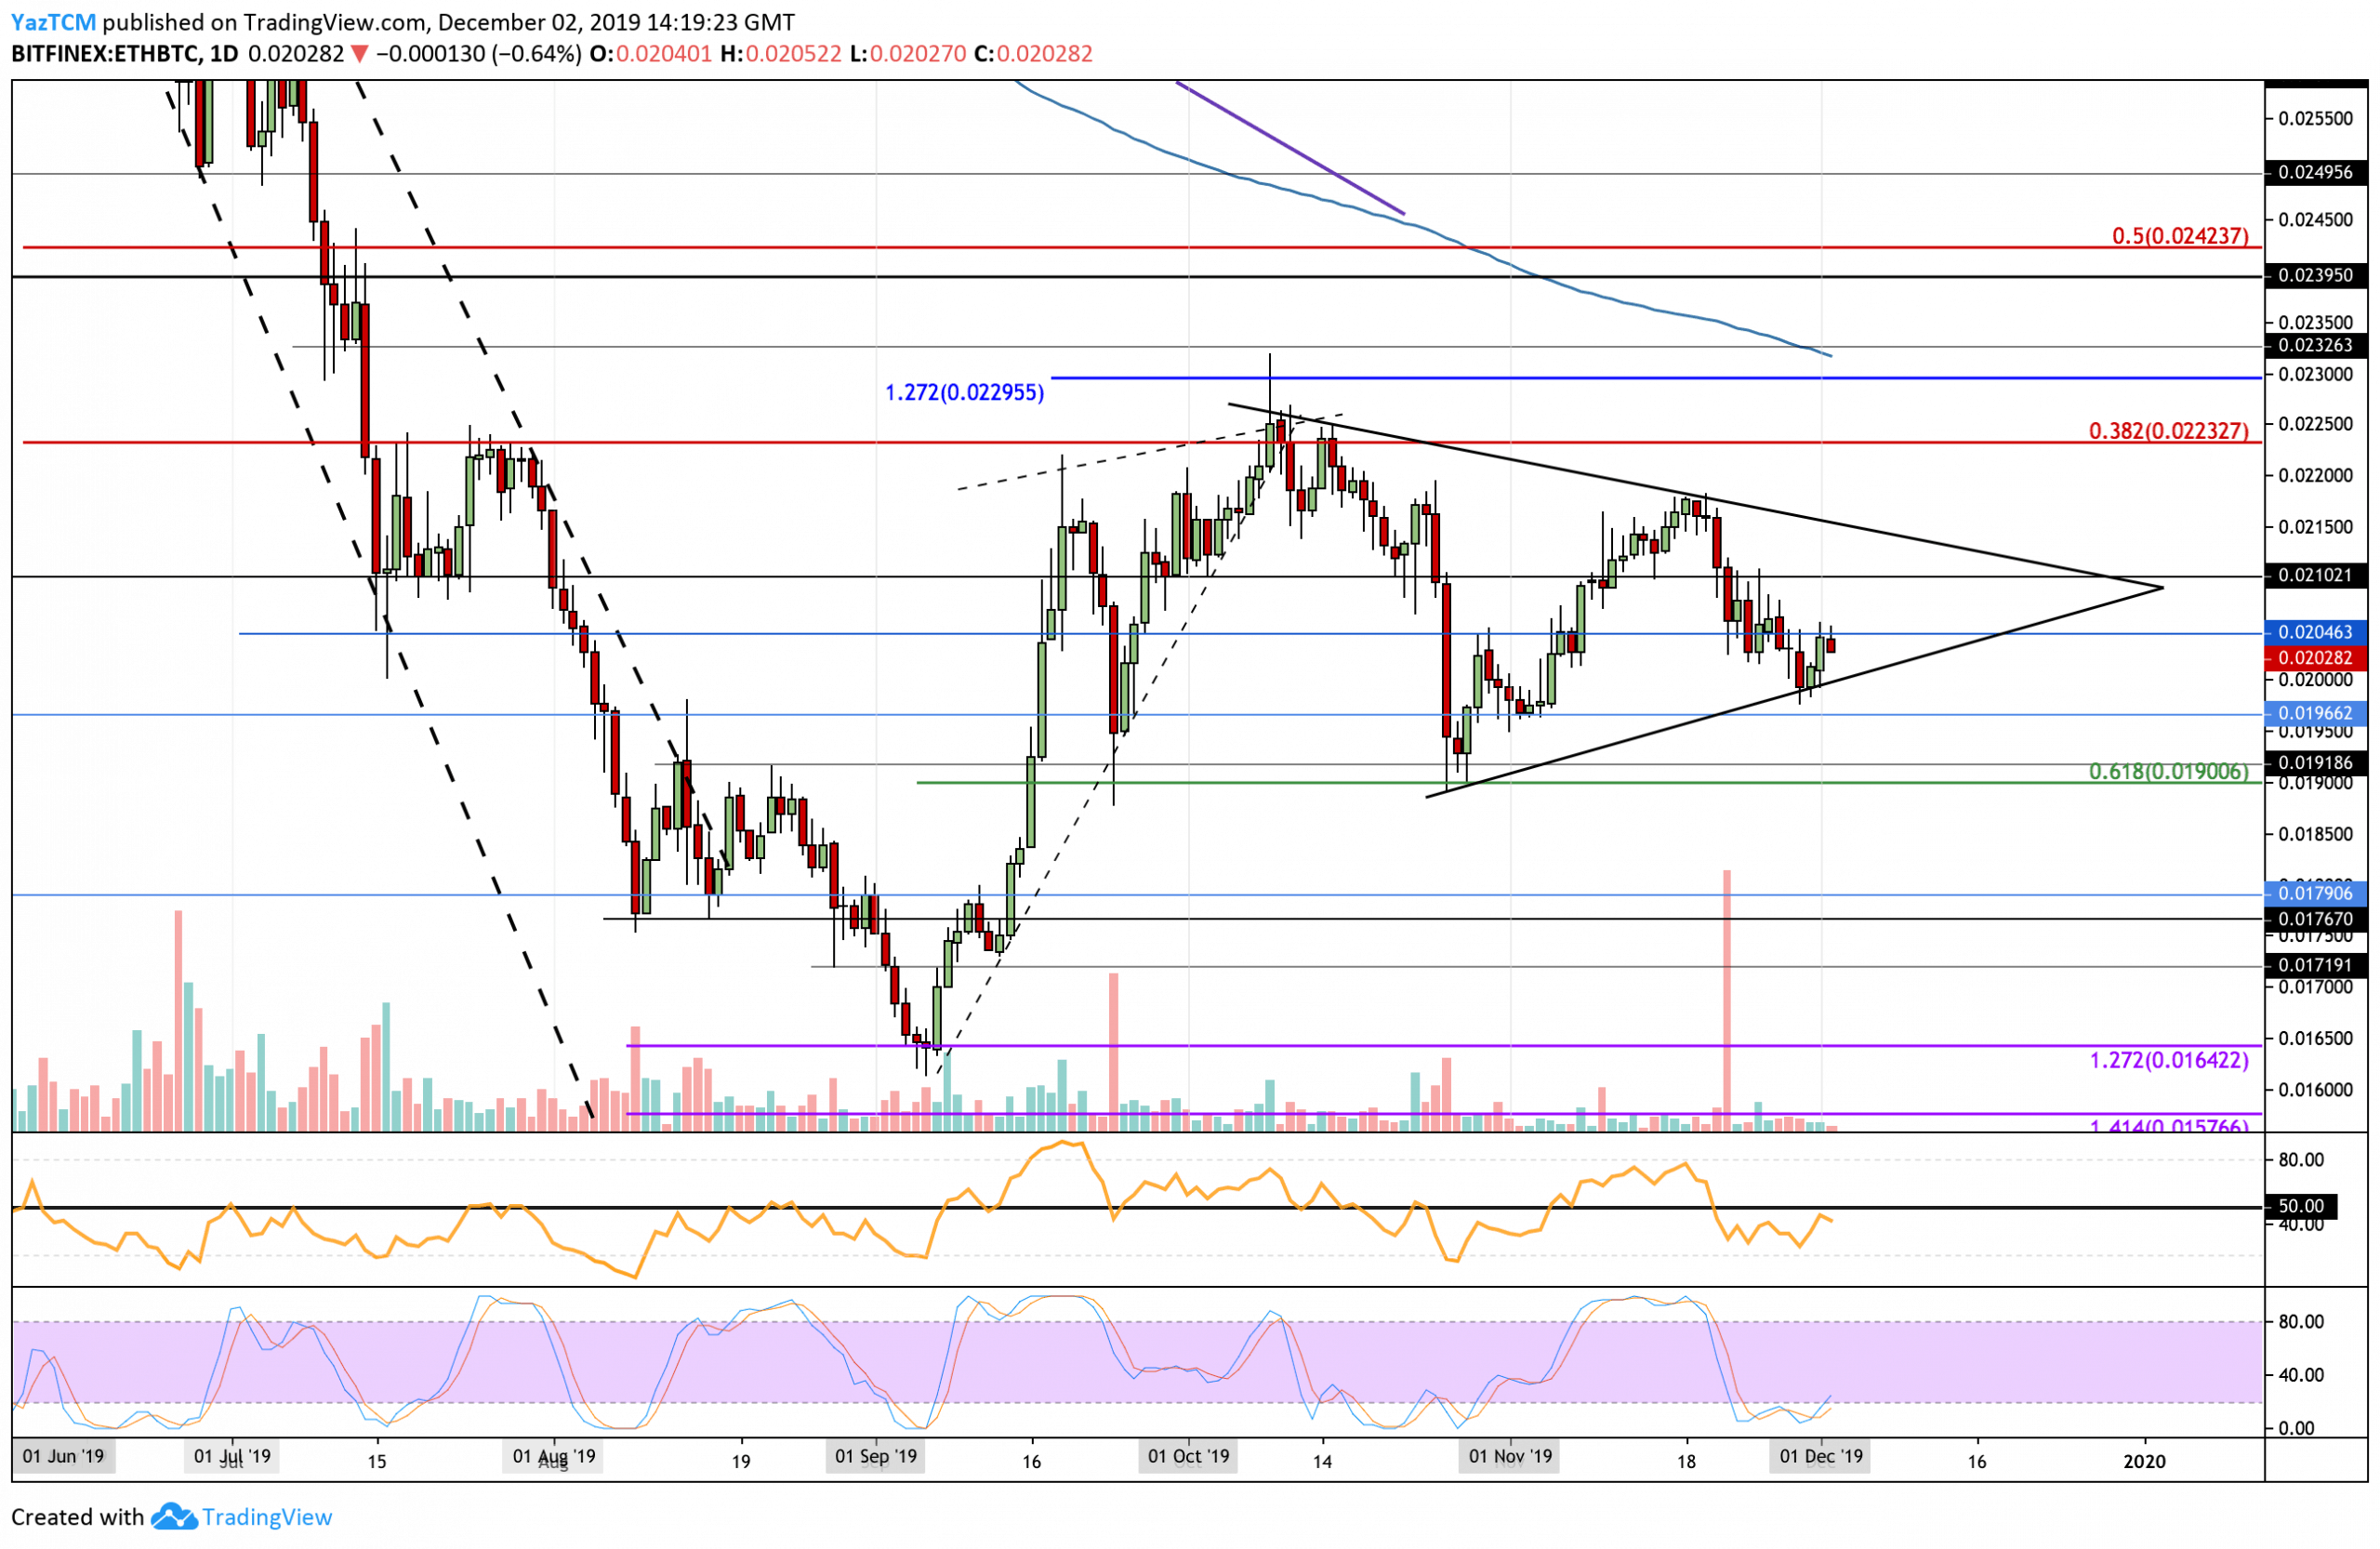 Against Bitcoin, Ethereum remains trading within the previously highlighted symmetrical triangle pattern. A breakout of this triangle should, theoretically, dictate the next direction for Ethereum.
The cryptocurrency bounced higher from the lower boundary of the triangle but has so far been unable to make any movement above the 0.0204 BTC level.
Ethereum Short Term Price Prediction
If the sellers continue to pressure the market lower we can expect immediate support at the lower boundary of the symmetrical triangle. Beneath the triangle, support can be found at 0.02 BTC, 0.01966 TBC and 0.019 BTC (0.618 Fibonacci Retracement level).
On the other hand, if the bulls regroup and manage to bring Ethereum above the resistance at 0.0204 BTC we can expect higher resistance to be located at 0.0210 BTC. Above this, resistance lies at the upper boundary of the triangle (at around 0.0215 BTC), and then at 0.022 BTC (bearish .382 Fibonacci Retracement).
The RSI has recently risen back into the 50 level but has failed to break above which indicates that the sellers are still in charge of the market momentum. However, the Stochastic RSI finally produced a bullish crossover signal which could actually help ETH/BTC break above the 0.204 BTC resistance.