Back at the beginning of September and a couple of weeks after the August EIP-1559, Standard Chartered released a report called Ethereum Investor Guide and its conclusion was that the asset in question could potentially reach anywhere between $27k and $35k. This research piece did end up circulating for a few days in crypto news outlets, Ethereum focused groups etc., but the document’s date of release happened to coincide with that nasty flash-crash (7th Sep; ETH’s price was slashed by roughly $900 or 25% within a few hours) and the sentiment in crypto immediately flippedto Extreme Fear. Ethereum Investor Guide seemed to quickly disappear from conversations and the community moved on with their lives.
Now, the price target range from the report does seem steep or to be frank, highly unrealistic in this cycle as ETH’s value would have to 10X from here to reach the prediction, but what attracted my attention was the claim that Ethereum is likely to perform better than BTC (BTC/USD) in the coming months (ETH to BTC ratio predicted in the paper at 0.16 with the current ratio at its lowest since August this year). Undoubtedly, Standard Chartered is a serious international bank and it is going to be very curious to see how their report ages in the last quarter of this year and going into the next one.
Is ETH (ETH/USD) going to outperform the King of Crypto and is The Flippening still in store for us, the crowd of Ethereum investors? Let’s find out if there are any clues in the charts and on-chain data, that could possibly point us in the right direction.
PRICE ACTION AND ON-CHAIN DATA
In order to get the right answers we need to start by asking the right questions and these in my mind would be: what is the likelihood of ETH performing better than BTC based on available data and what trajectory and direction is most likely for the second largest cryptocurrency (ETH market cap: $426B compared to Bitcoin’s $1035B; ETH domination at 17.7% compared to BTC’s 42.9%).
First of all, looking at the ETH/BTC (ETH/BTC) chart we must identify 0.65 as our most significant level (thick purple line) that has been respected as both support as well as resistance since May this year.
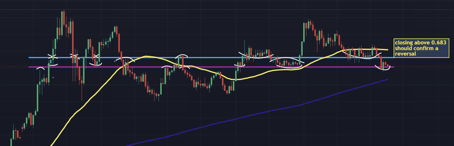
As of the moment I’m writing these words Ethereum is worth 0.656 having just spent the last two days testing our purple line. It’s fallen to lowest levels since early August but this should not in my opinion be a reason to worry if we remember the natural ‘’pecking order’’ among cryptocurrencies during pumps. When markets are on a tear, Bitcoin is the fastest one to climb, then large-caps, then mid-caps and so on. So when BTC loses a bit of momentum on its highly anticipated way to new ATH, we should expect ETH to lead the way, for a period of time, in terms of growth.
This time-tested characteristic of the dynamics in crypto in combination with the value of ETH/BTC being the lowest in multiple weeks already gives us some idea as far as what can happen next in this pair. In order to get more confidence we should wait for another daily candle and if we do end up getting the Saturday or Sunday close above 0.683 (top of the red daily candle last Wednesday), then we can consider opening a long position, or converting some of our BTC into ETH. This 0.682-0.683 level (thick light-blue line) has been just as important as 0.65 in respect to previous support/resistance, dating back 5 five months ago as well.
This five-week-old downtrend on ETH/BTC might be coming to an end anytime this weekend, prepare accordingly. If Ethereum breaks above 0.683, it will also almost certainly have broken $3670-3700 which is currently our main resistance area and probably the biggest hurdle to jump over before attempting to break the ATH.
To gain even more confidence in ETH’s potential mid-term strength, not only in relation to BTC but also to the rest of the market, let’s turn our attention to on-chain metrics now. There are some great findings that I got for you, my readers, and there are quite a few, so allow me to solely list the most meaningful ones real quick:
- the total amount of ETH on exchanges is the lowest it’s been for years
- ETH was a deflationary asset on some days (more coins burnt than minted due to EIP-1559) with the rate of burning increasing
- staking for ETH2.0 reached 7.95M ETH resulting in almost 7% of total supply being frozen until ETH officially becomes ETH 2.0, so another chunk of supply is off the table
- whales have been steadily accumulating both ETH and BTC since the crash back in May
To sum it all up: on chain data points to an extremely solid foundation for a potential trade or purchase/conversion as we are starting to see a good set-up right now, and if ETH/BTC breaks above 0.683 (additionally we could wait for the ratio to break above 0.705 as this would mean breaking above the 50 MA), we should have an opportunity to pull the trigger on a high-percentage play. As always, remember to set up stop-losses, good luck and see you all next week.