After treading bearish sentiments for the past couple of months, Ethereum’s valuation indicated a break away from the bears at press time. In the last 11 days, Ethereum’s price registered a growth of over 10 percent in the charts. Short-term and long-term indicators also turned bullish as the price indicated an upward imminent break.
6-hour chart
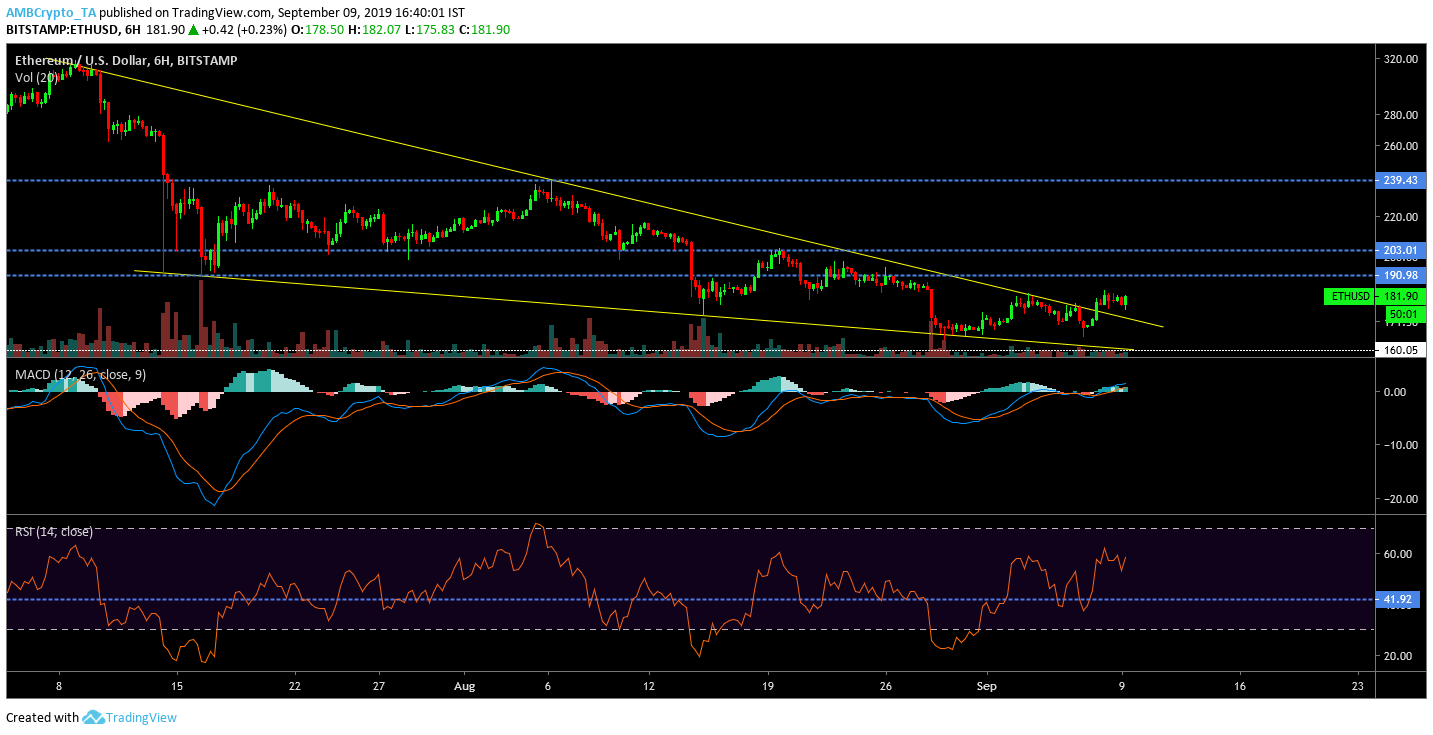
Source: Trading View
The 6-hour chart represented a gradual decline over the past two months. Major supports at $239.43 and $203.01 were also breached but positive signs were evident at the moment. As observed, the price movement of ETH exhibited a falling wedge pattern which was breached in the charts. The breakout surfaced but lacked significant bullish momentum. Ethereum’s price was currently valued at $181.90 and a major surge should pave the way for the coin to test resistance at $190.98 and $203.01 in the coming days.
MACD indicator supported the possibility of an imminent bullish break and the Relative Strength Index [RSI] was indicative of active traders.
However, the short-term chart provided more clarity.
1-hour chart
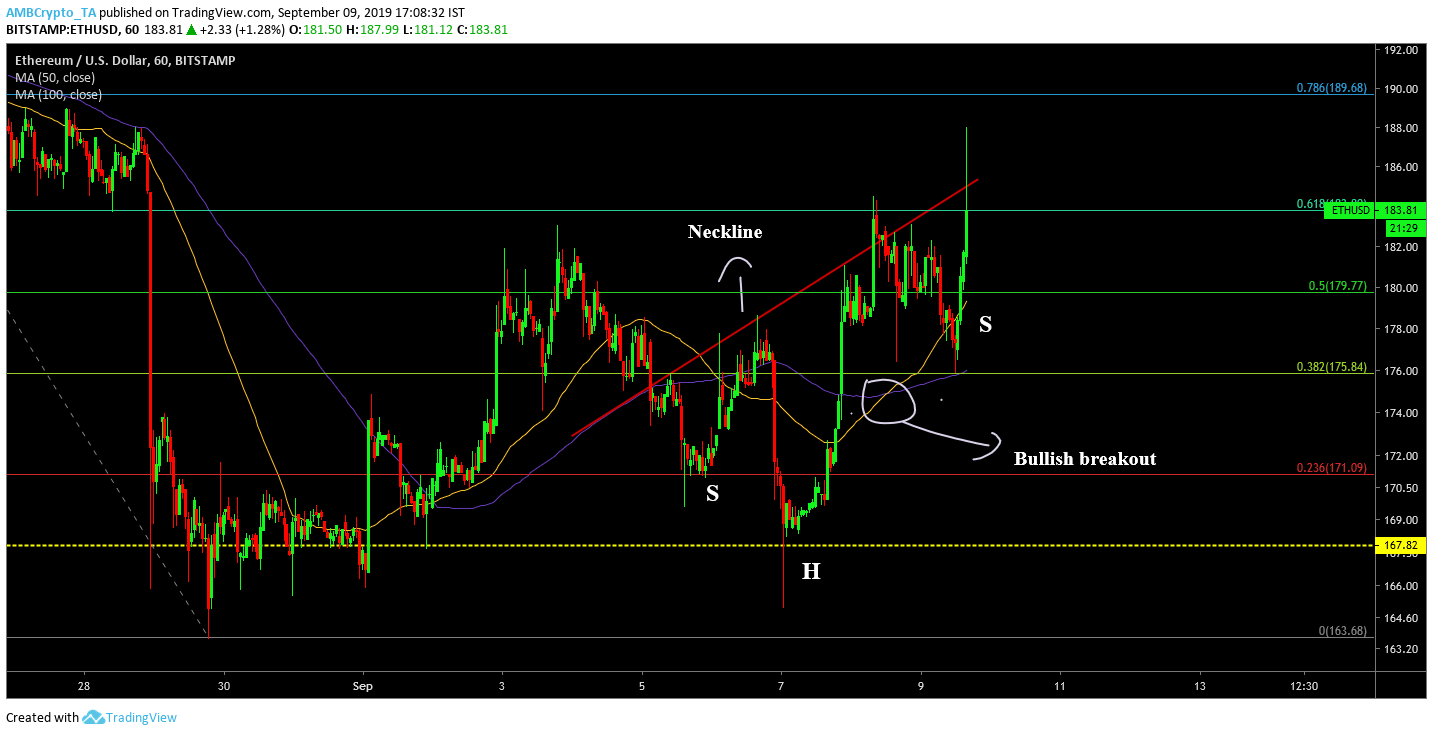
Source: Trading View
1-hour chart of Ethereum exhibited volatility as over the past 6 days, its valuation navigated through a fall of 10.89 percent, which was immediately followed by a hike of over 8 percent. In between the commotion, the price movement formed a major bullish pattern.
At press time, it was observed that Ethereum’s price exhibited an inverted Head and Shoulder pattern which was represented by a defined neckline in the charts. The price adhered to the current pattern, which suggested a bullish breakout.
Additionally, another indicator boosted the possibility of a surge. The 50-moving average line completed a bullish crossover with the 100-moving average line which raised the likelihood of another hike.
According to Fibonacci retracement lines, the breakout should see the valuation test the immediate resistance at $183.7 and then head toward resistance at $189.63.
Conclusion
Ethereum’s price was relishing a fortunate turn of events at press time, as a breach of falling wedge pattern at the 6-hour chart indicated a bullish recovery. Price in the short-term may take a similar path as the coin approached another bullish pattern breach.