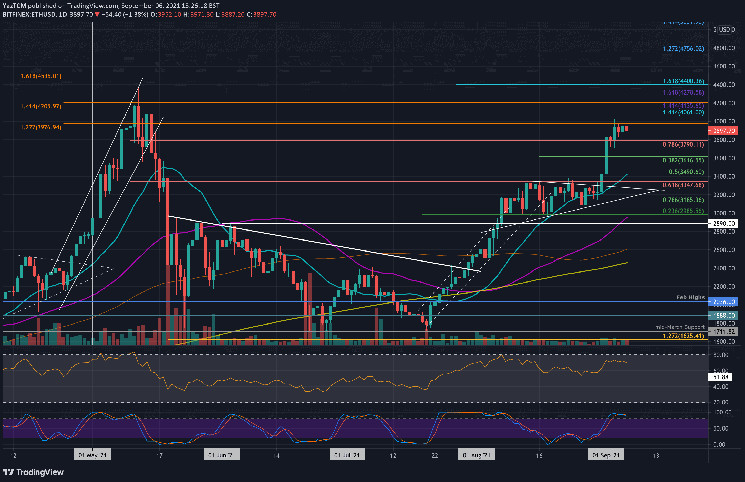
ETH/USD – Ether Edges Closer To $4000 Resistance.
Key Support Levels: $3800, $3615, $3490.
Key Resistance Levels: $3975 – $4000, $4060, $4200.
Ethereum broke the previous symmetrical triangle pattern consolidation on the final day of August and had been surging aggressively ever since. On Friday, ETH surged higher from $3790 (bearish .786 Fib) and climbed into the resistance at $3975 (1.272 Fib Extension).
The coin made two attempts to break this resistance over the weekend and failed on both occasions. It made another attempt today but has since rolled over and is trading at around $3900.
ETH-USD Short Term Price Prediction
Looking ahead, the first strong resistance lies between $3975 and $4000. Beyond $4000, additional resistance lies at $4060 (1.414 Fib Extension), $4200 (1.414 Fib Extension – orange), and $4400 (1.618 Fib Extension – blue).
On the other side, the first support lies at $3800. This is followed by $3615 (.382 Fib), $3490 (.5 Fib), $3400 (20-day MA), and $3350. Added support is located at $3185 (.786 Fib).
The RSI is starting to diverge away from price action as it heads lower. Nevertheless, the momentum is strongly in the buyers’ favor.
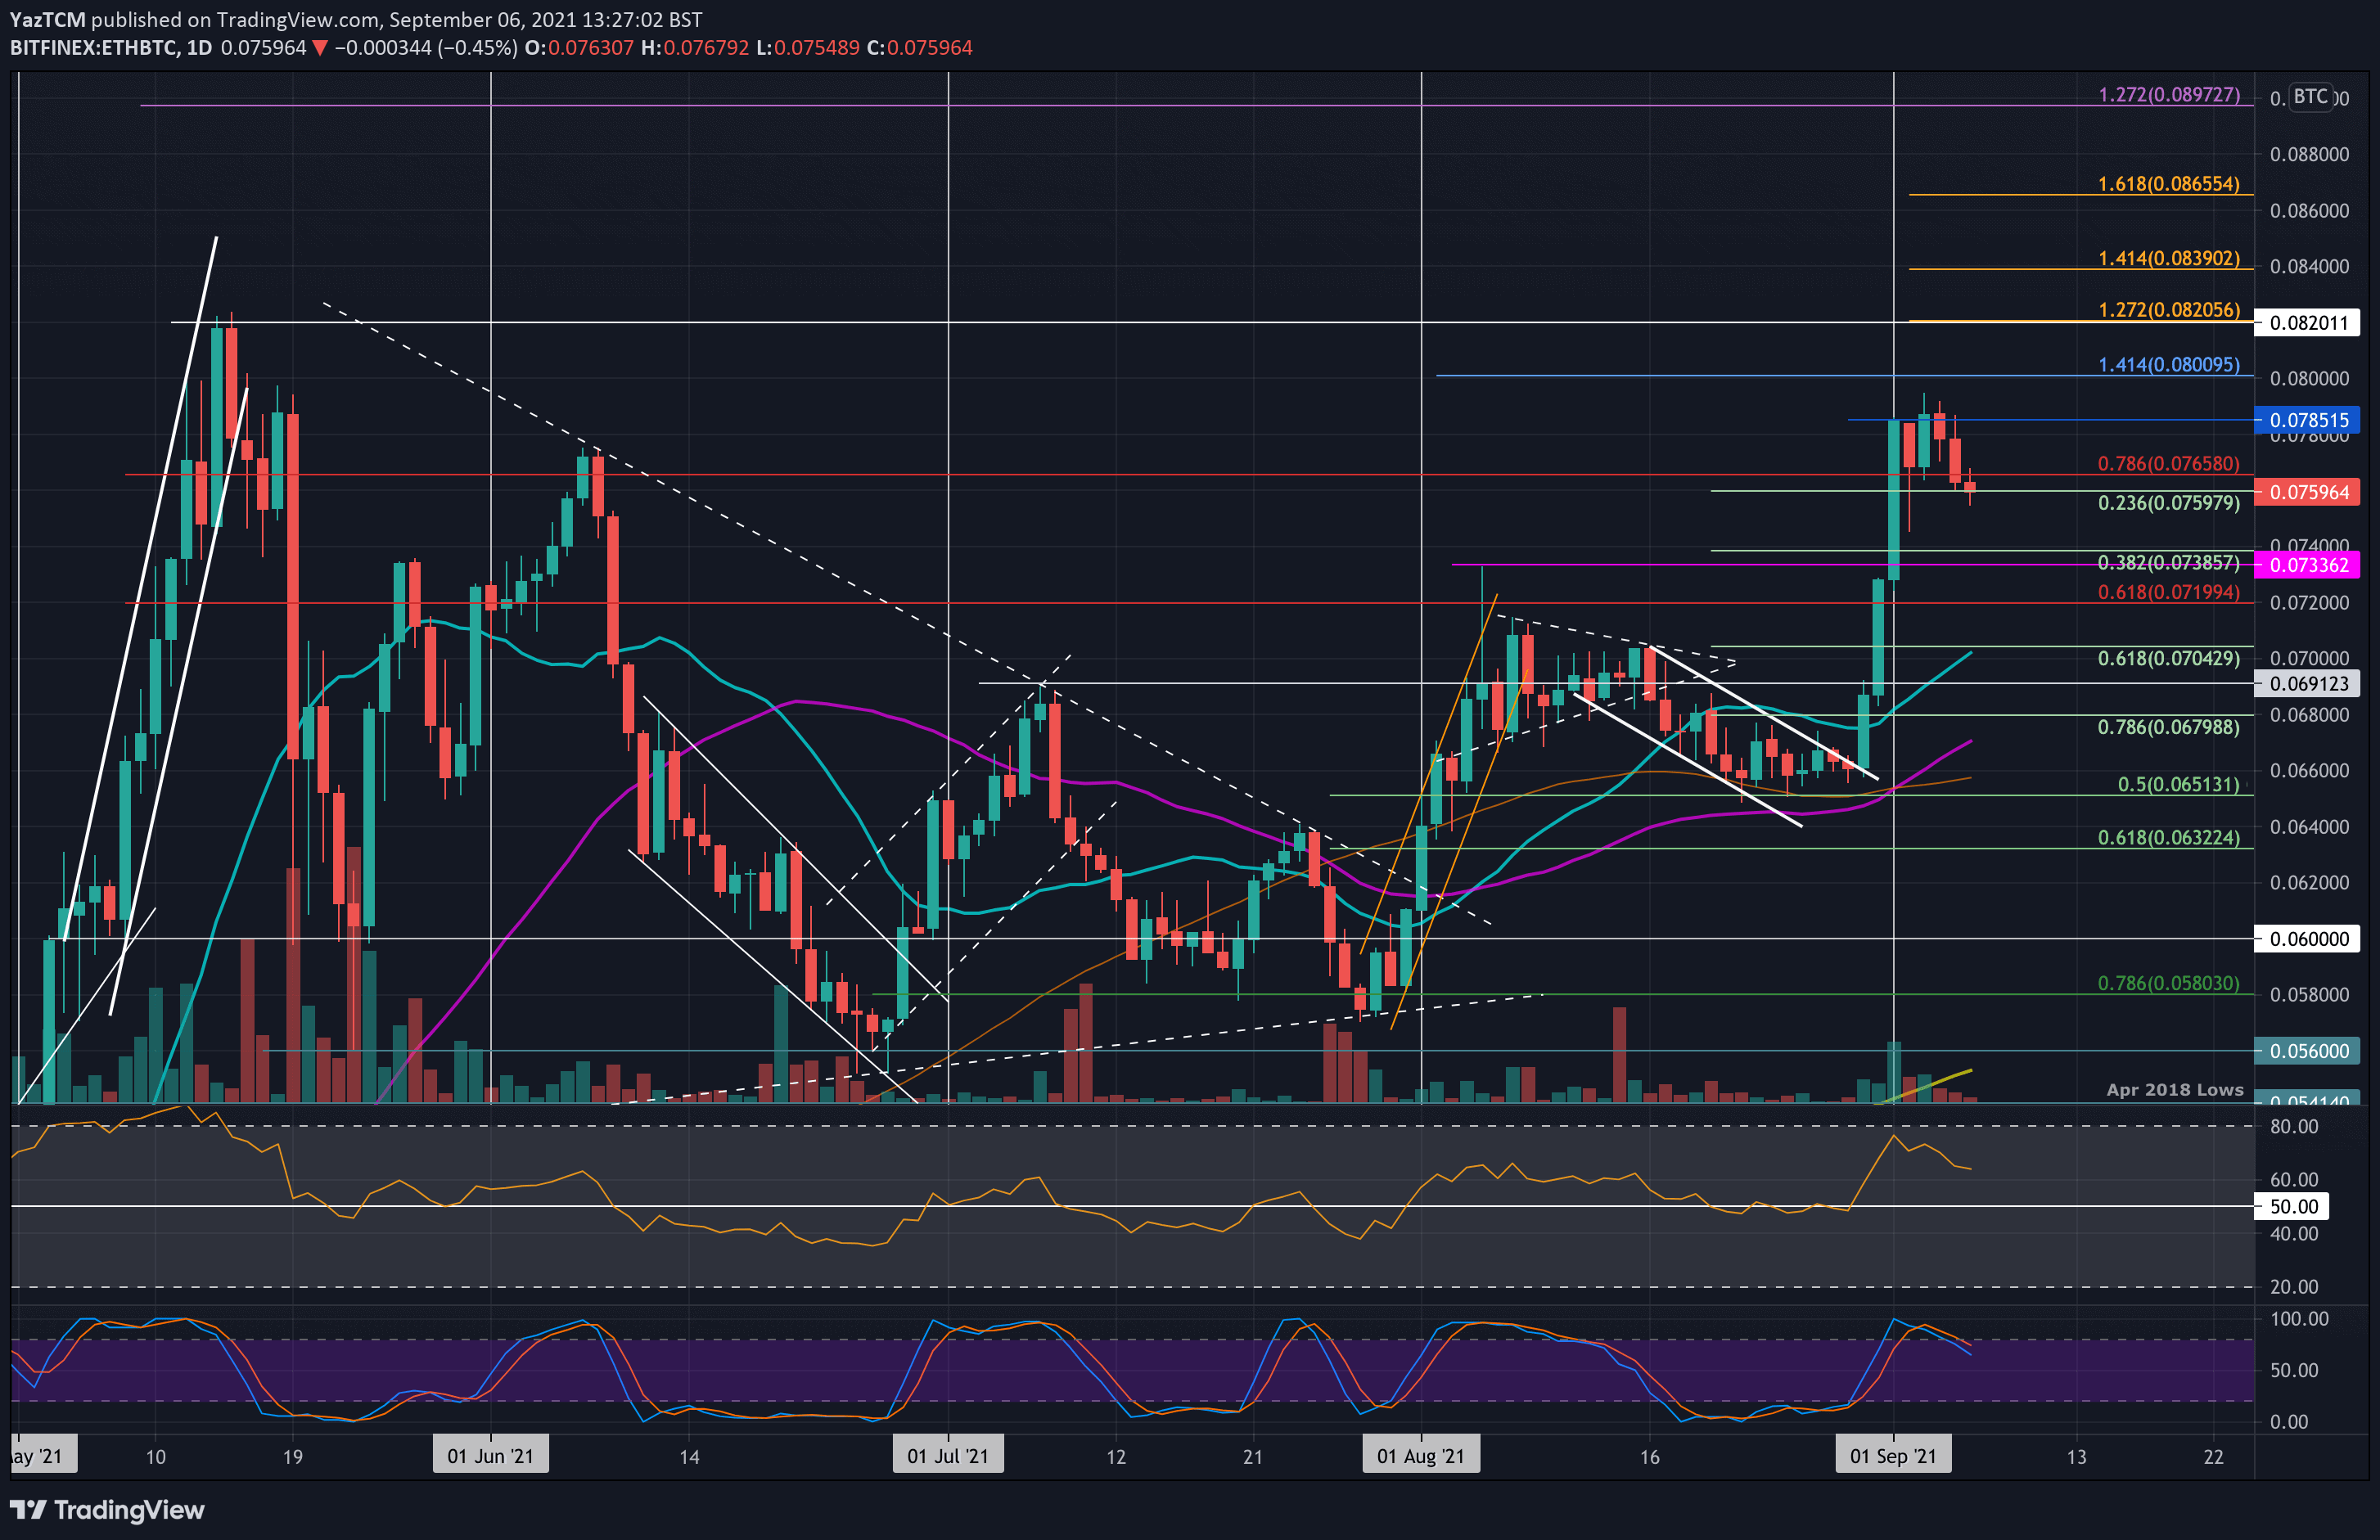
ETH/BTC – ETH Battles To Hold .236 Fib
Key Support Levels: 0.0750 BTC, 0.0735 BTC, 0.072 BTC.
Key Resistance Levels: 0.0765 BTC, 0.0785 BTC, 0.08 BTC.
ETH broke a descending price channel at the end of August and surged higher. At the start of September, ETH reached as high as 0.0785 BTC. On Friday, the cryptocurrency reached as high as 0.079 BTC but rolled over from there and started to head lower over the weekend.
Today, ETH is battling to hold the support at 0.0759 BTC, provided by a .236 Fib Retracement.
ETH-BTC Short Term Price Prediction
Moving forward, if the bears break beneath 0.0759 BTC, the first support below lies at 0.0735 BTC (August high & .382 Fib). This is followed by 0.072 BTC, 0.07 (.618 Fib & 20-day MA), and 0.0691 BTC.
On the other side, the first resistance lies at 0.0765 BTC (bearish .786 Fib). This is followed by 0.0785 BTC, 0.08 BTC, and 0.082 BTC (1.272 Fib Extension).
The RSI has been falling since the start of the month as the previous bullish momentum starts to fall. However, the momentum remains in the buyers’ favor.