The week began with Ethereum [ETH], the second largest cryptocurrency by market cap, glowing both red and green. According to CoinMarketCap, at press time, the cryptocurrency was trading at $139.44, with a market cap of $14.68 billion. The coin recorded a trading volume of $4.09 billion over the past 24 hours, and a rise of around 2% in the past seven days.
1-hour
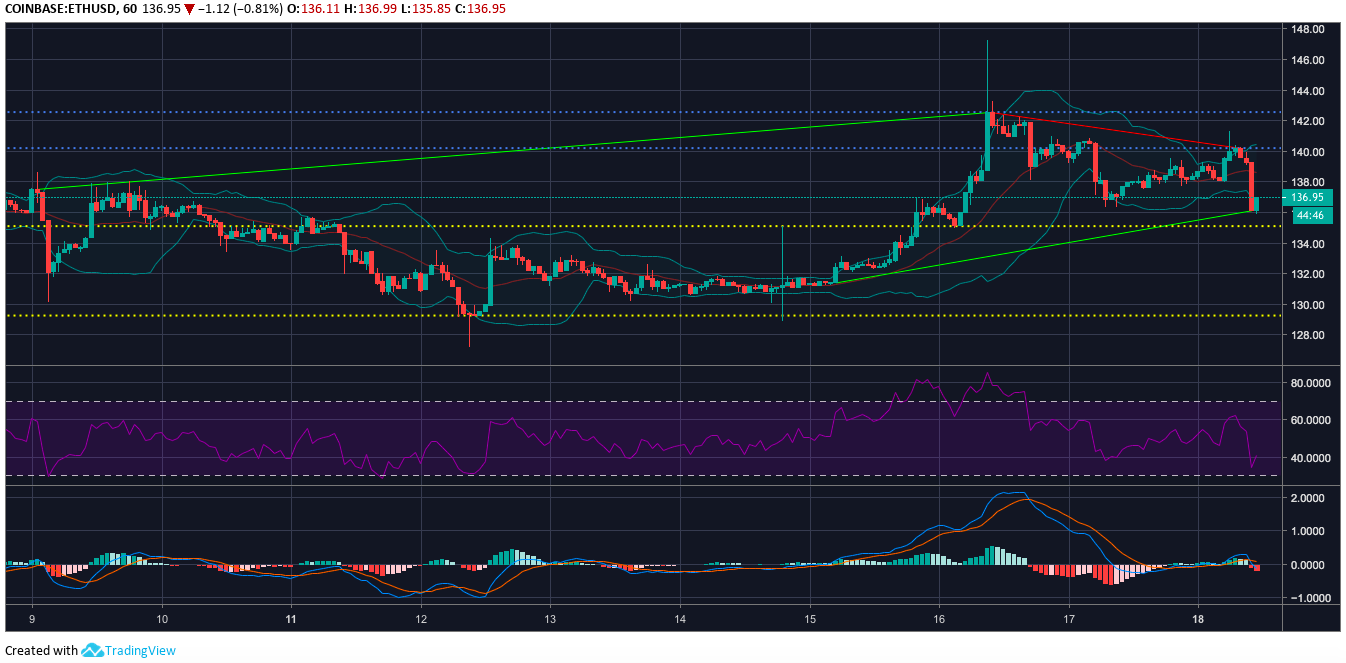
Ethereum one-hour price chart | Source: TradingView
In the one-hour chart, the cryptocurrency displayed a downtrend from $142.52 to $140.19. The uptrends for the coin were pictured from $137.51 to $142.52, and from $131.40 to $136.11.
The immediate resistance for the coin stood at $140.21, and strong resistance was at $142.56. The coin laid its immediate support at $135.11, and strong support at $129.27.
Bollinger Bands indicated a highly volatile market for the cryptocurrency as the bands diverged from each other.
RSI indicated that the buying pressure for the coin was proportionate to the selling pressure in the market.
MACD predicted a bearish market for the cryptocurrency, with the moving average line moving south after meeting the signal line.
1-day
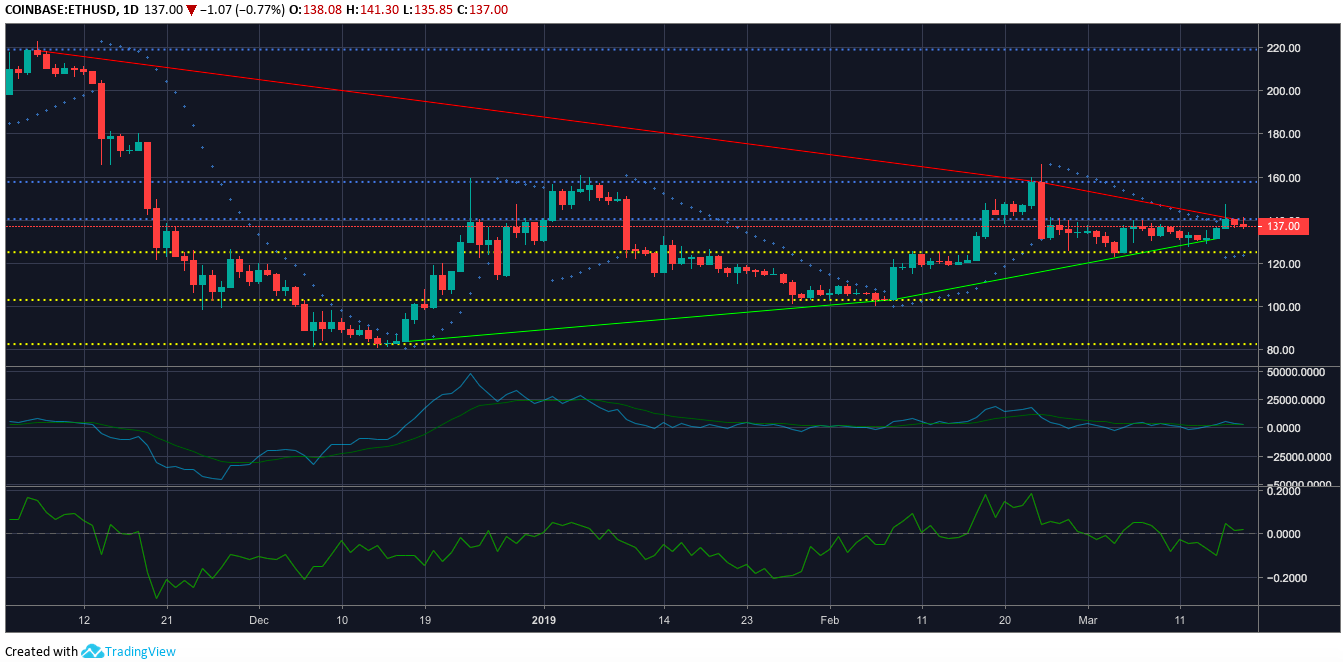
Ethereum one-day price chart | Source: TradingView
In the one-day chart, the downtrend for the cryptocurrency was recorded from $218.66 to $157.55, and further down from $157.55 to $140.49. The uptrend for the coin was outlined from $83.74 to $103.22, and further up to $131.40.
The immediate resistance for the cryptocurrency was at $140.52, and strong resistance was at $157.75. The coin’s immediate support was at $125.18, while strong support was seen at $82.59.
Klinger Oscillator showed that the bull successfully pulled the coin from the bear’s grip, as the reading line moved above the signal line, after a crossover. However, the lines were on the verge of another crossover, which could result in a trend reversal.
Chaikin Money Flow line was above the zero mark, opening the doors for a bull run in the coin market as money was starting to flow back into the market.
Parabolic SAR’s dotted lines aligned below the candlesticks, indicating a bullish phase for the coin.
Conclusion
The market finally decided to give the bull another chance, with most indicators for the coin favoring it. The bear was only left with the MACD, from the one-hour chart.