The week started well for the cryptocurrency market as a majority of the currencies were pictured in green on the seven-day graph. This included top currencies such as Stellar [XLM], Litecoin [LTC], Binance Coin [BNB], EOS, and Ethereum [ETH].
According to CoinMarketCap, at press time, Ethereum [ETH] was trading at $136.14, with a market cap of $14.32 billion. The trading volume of the coin was over $4 billion, and the coin witnessed a hike of over 5% over the past seven days.
1-hour
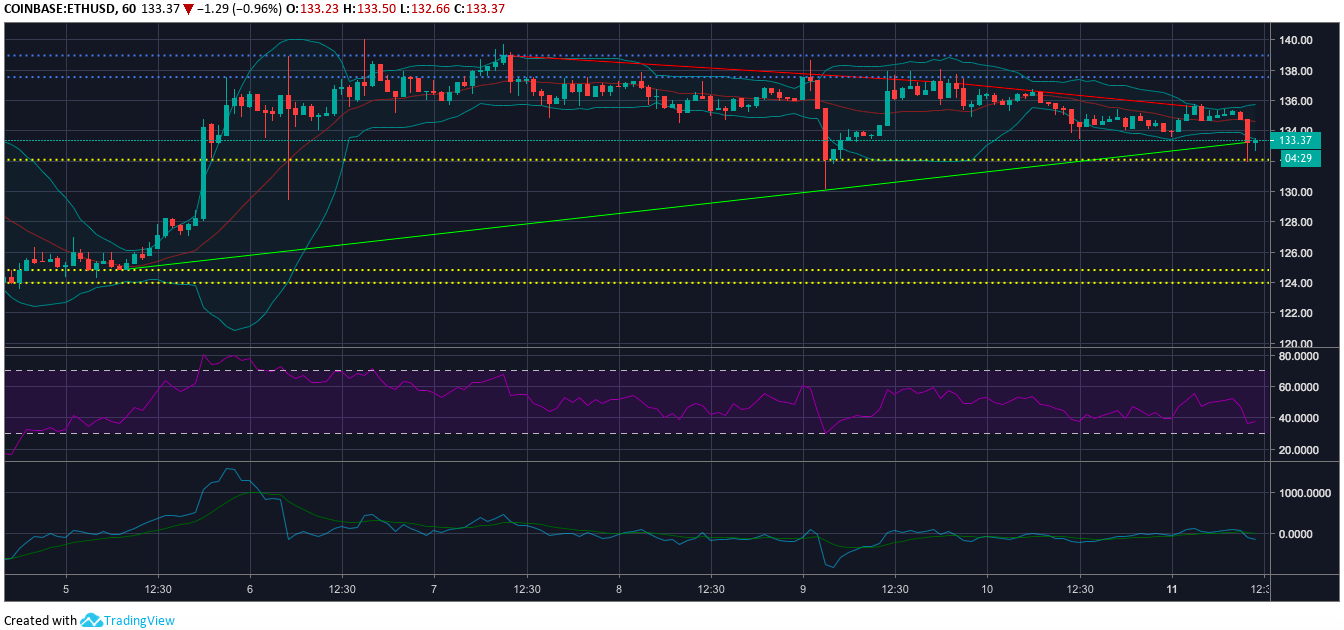
Ethereum [ETH] one-hour price chart | Source: TradingView
The immediate resistance of the cryptocurrency was positioned at $137.53 and strong resistance was at $138.96. The immediate supports, on the contrary, were at $132.09 and $124.82. Strong support for the cryptocurrency was carefully placed at $123.98.
Klinger Oscillator portrayed a bearish phase for the cryptocurrency as the reading line placed itself below the signal line after a crossover.
Bollinger Bands indicated reduced volatility for the coin in the market as the gap between the bands narrowed.
RSI displayed a balanced market for the coin as the buying pressure was equally met by the coin’s selling pressure.
1-day
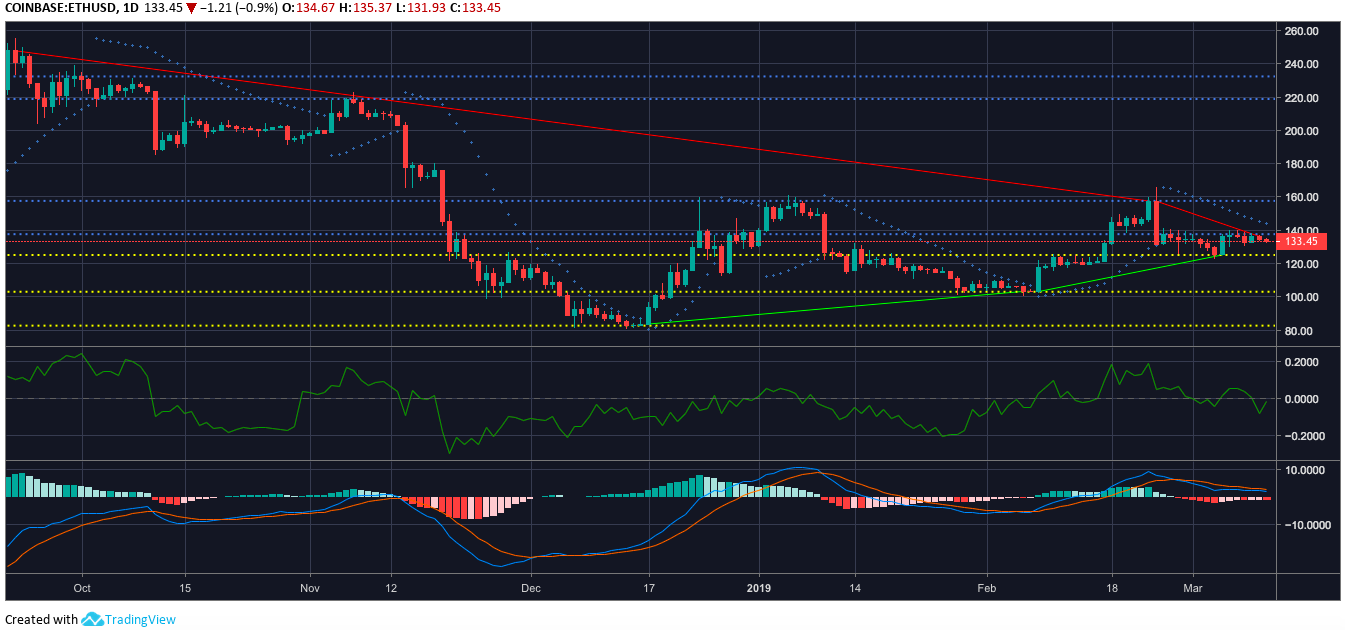
Ethereum [ETH] one-day price chart | Source: TradingView
The immediate resistance for the cryptocurrency was marked at $137.69, while strong resistance was found at $157.66. The coin’s immediate supports were found at $125.19 and $103.13, while the stronger support was marked at $82.80.
Chaikin Money Flow showed a bearish wave for the coin as the money kept flowing out of the market.
MACD demonstrated bearish signals after the moving average line went south after meeting signal line.
Parabolic SAR had its dotted markers above the candlesticks, suggesting a bearish phase for the coin.
Conclusion
Despite the sporadic green signals, the coin was forecasted to be with the bear by indicators such as the MACD, CMF, and Parabolic SAR.