Ethereum (ETH) Price Analysis – March 6. For the past two months,
Gaining 7% in the last 24-hours, Ethereum’s volume size is about $5 billion with $14.3 billion market cap, according to CoinMarketCap.
The successful Constantinople and St. Petersburg upgrades might also be one of the reasons for the current positive sentiments on Ethereum. The latest upgrades
ETH-USD Market
Resistance levels: $165, $180, $200
Support levels: $120, $100, $80
Looking at the medium-term structure, Ethereum appeared to be moving in an ascending wedge pattern. As the token climbs, price volatility becomes shrink; approaching the end of the wedge. ETH is currently trading at $136 price level.
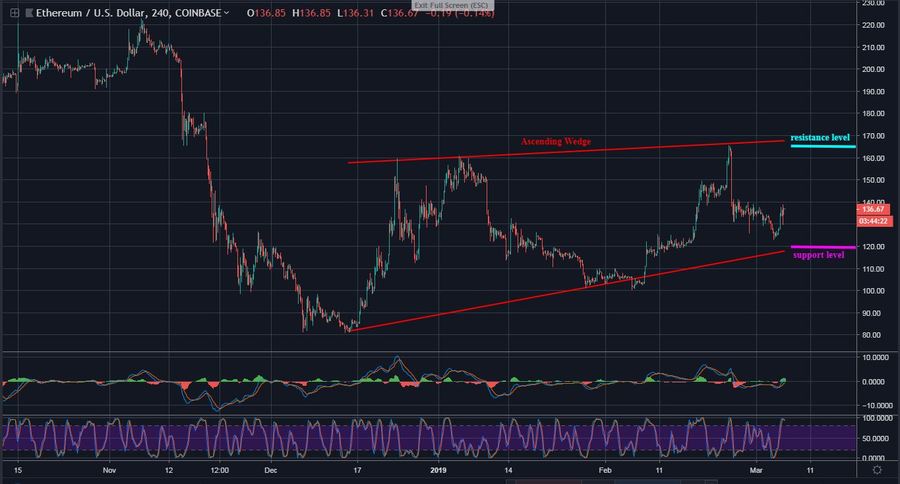
Ethereum is at the overbought condition of the 4-hours Stochastic RSI. A selling pressure is likely to pull price to the oversold zone, retesting $120 support level. Otherwise, the buying pressure might rally to a peak of $165 resistance, where the upper trend line lies.
However, Ethereum would continue to respect the trend lines until a break play out on both ways, possibly at the close of the wedge angles. A potential bearish break could bottom at $100 support and beyond. Also, a bullish break is likely to visit $180 resistance and beyond. The 4-hours MACD would be waving at the positive level.
ETH-BTC Market
Following the same pattern with the Dollar market, Ethereum is flying on a Medium-term outlook after touching 0.0033 SAT support at the lower trend line on Monday. Now, the buyers aim 0.0039 SAT resistance. A rebound might occur testing the upper trend line.
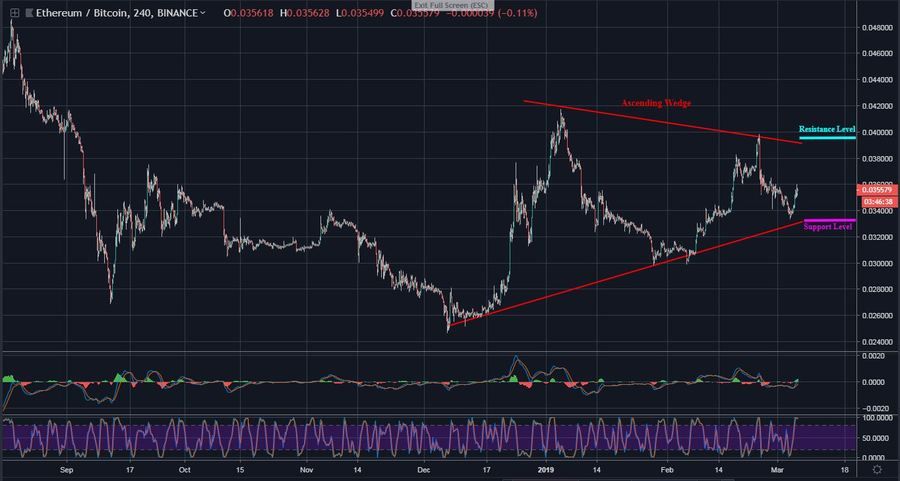
ETH is fast nearing the wedge angle. There might be a change in trend at any moment. The 4-hours Stochastic RSI suggests a potential sell. The previous support level at 0.0033 SAT might be retouched. A further decline is likely to sink ETH to 0.003 SAT support.
A drive above the ascending wedge; where 0.0039 SAT resistance level lies could further price push to 0.0042 SAT resistance and beyond. By then, the 4-hours MACD would be trending at the positive level. However, the price action will continue to follow a bullish pattern until a surge is experienced.
Please note: Cryptovibes.com is not a financial advisor. Do your own research before investing your funds in any financial asset or presented product or event. We are not responsible for your investing results.