ETH/USD – Ether Retests Critical $2k Support
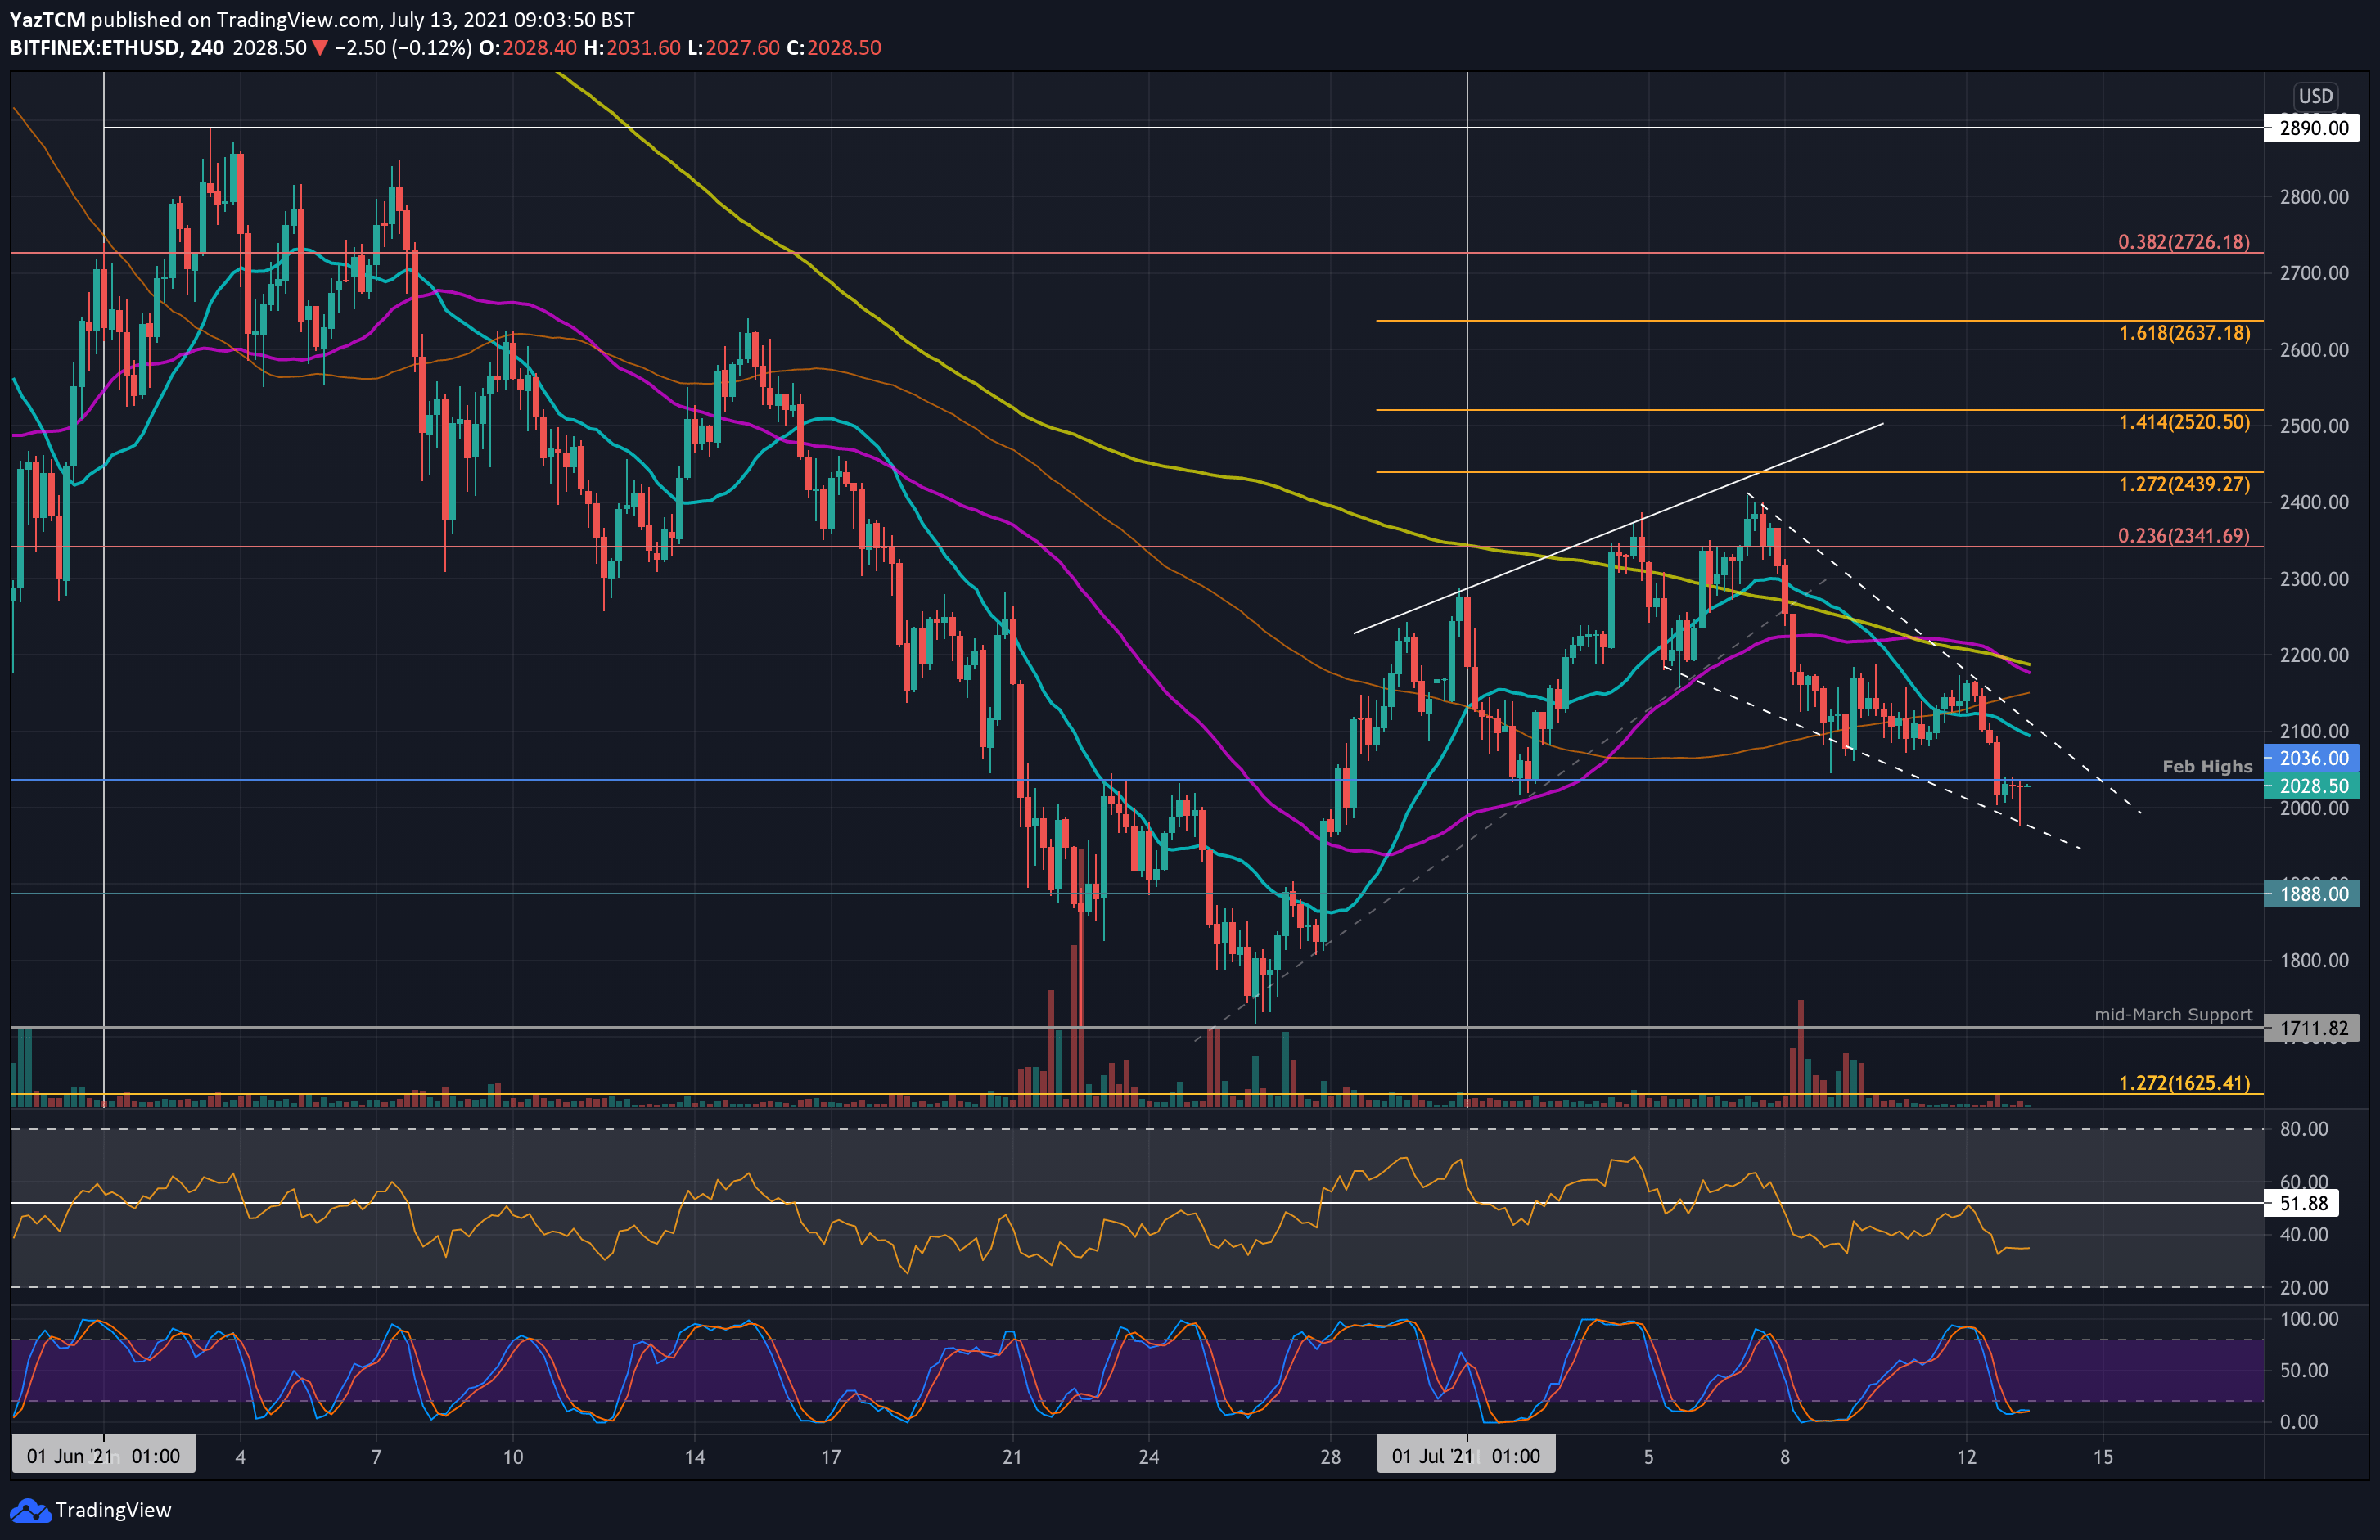
Key Support Levels: $2035 – $2000, $1888, $1710.
Key Resistance Levels: $2120, $2200, $2340.
Ethereum is starting to struggle again as it falls into critical support around $2000. It was performing well at the start of the month but failed to break resistance at $2340, provided by a bearish .236 Fib Retracement & the 50-day MA level. Last week, it dropped from the 50-day MA to land into the support at 20-day MA at $2120, where it held for four days.
The coin fell beneath that level yesterday and continued to crash towards $2000 today. The support between $2035 and $2000 will be crucial to prevent another capitulation over the coming weeks.
On the short-term 4-hour chart, Ethereum is trading inside a falling wedge which are typically bullish patterns that break toward the upside.
ETH-USD Short Term Price Prediction
Looking ahead, the first crucial support lies between $2035 (200-day MA) and $2000. This is followed by added support at $1888 (April low & .886 Fib) and $1710 (mid-March Support)
On the other side, the first resistance lies at $2120 (20-day MA). This is followed by $2200 (falling trend line), $2340 (50-day MA & bearish .236 Fib), and $2400.
The daily RSI is trending lower after failing to break the 50-level last week. The falling RSI indicates that the bearish momentum is steadily increasing but the shallow slope suggests there is still hope to defend $2000.
ETH/BTC – Bears Push To New July Lows
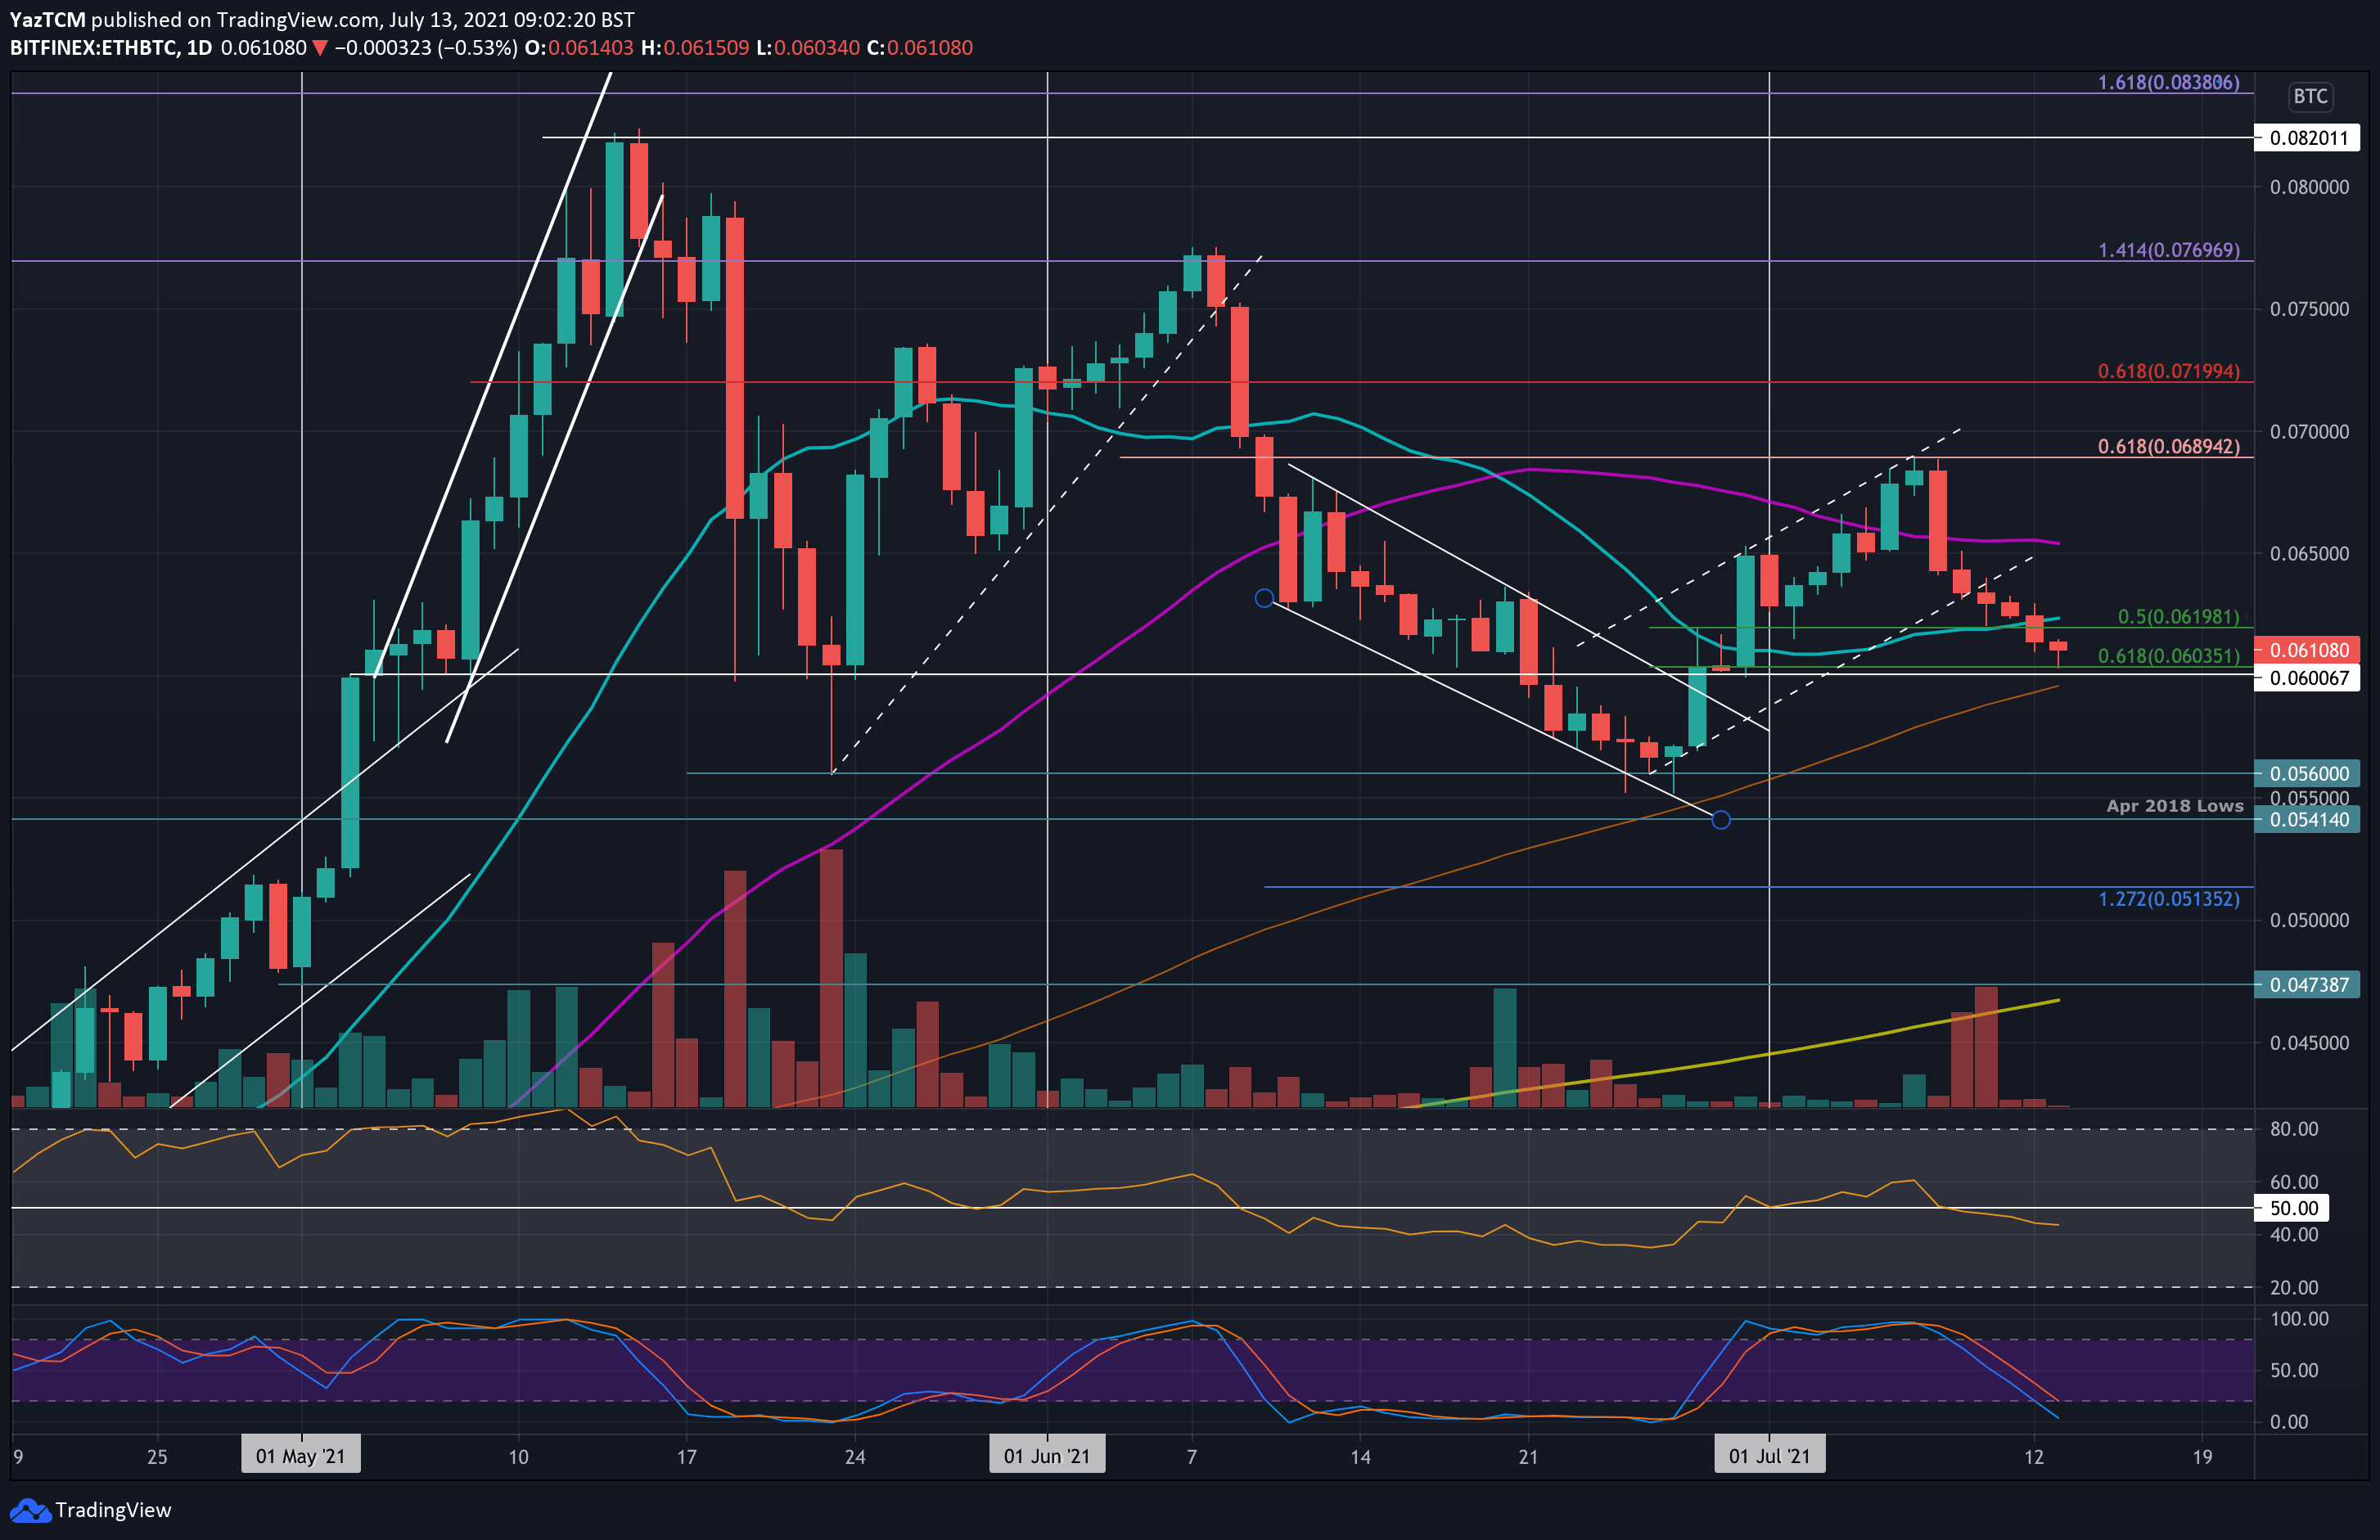
Key Support Levels: 0.06 BTC – 0.0595 BTC, 0.056 BTC, 0.055 BTC.
Key Resistance Levels: 0.0623 BTC, 0.065 BTC, 0.069 BTC.
Etheruem hit a new July low today after falling as low as 0.0603 BTC (.618 Fib Retracement). Since the end of June, the cryptocurrency was trading inside an ascending price channel but failed to break above resistance at 0.069 BTC (bearish .618 Fib) last week.
It rolled over from there and eventually fell beneath the ascending price channel last week. It continued lower yesterday as it broke the 20-day MA to hit 0.0603 BTC today.
ETH-BTC Short Term Price Prediction
Moving forward, the first support lies between 0.060 BTC (.618 Fib) and 0.0595 BTC (100-day MA). This is followed by 0.056 BTC (June support), 0.055 BTC (June low), and 0.0541 BTC (April 2018 lows).
On the other side, the first resistance lies at 0.0623 BTC (20-day MA). This is followed by 0.065 BTC (50-day MA), and 0.069 BTC (bearish .618 Fib).
Again, the daily RSI is falling here as it breaks back beneath the midline. However, it is still above the 40 level, indicating a weak bearish momentum within the market currently.