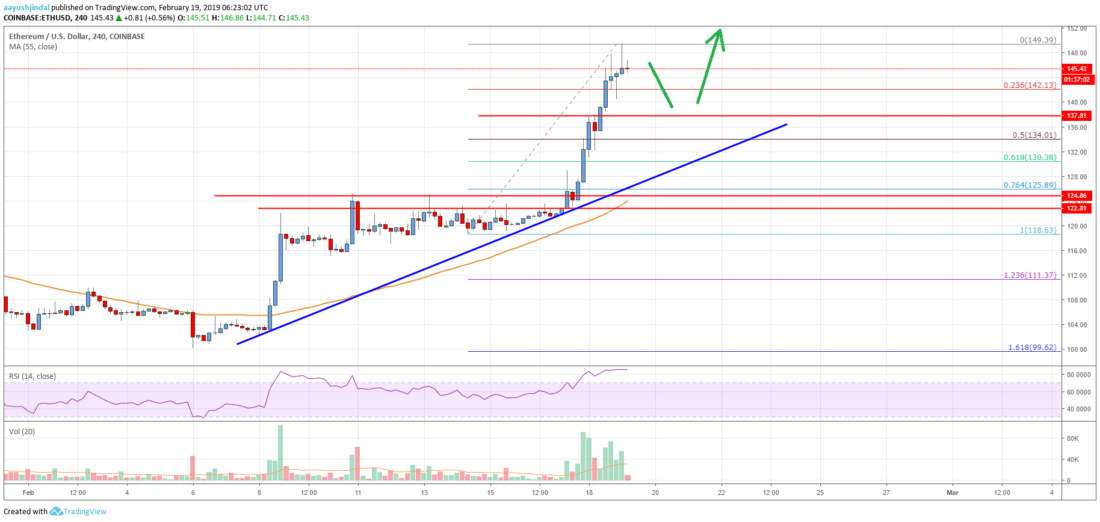
- Ethereum price rallied significantly and broke the $124 and $137 resistance levels against the US Dollar.
- ETH traded towards the $150 level and formed a new monthly high at $149.
- There is a key bullish trend line formed with support at $134 on the 4-hours chart (data feed from Coinbase).
- The current trend suggests more gains above the $150 and $156 levels in the coming days.
Ethereum price moved into an uptrend above the $137 resistance against the US Dollar. ETH is following a bullish path and it could continue to rise towards the all-important $160 resistance.
Ethereum Price Analysis
After a bullish break above the $110 resistance, Ethereum price started consolidating gains against the US Dollar. The ETH/USD pair struggled to clear the $124-125 resistance, but finally buyers had the upper hand. The price started a strong upward move and broke the $124 and $137 resistance levels. There was even a close above the $137 level and the 55 simple moving average (4-hours). The recent upward move was convincing as the price traded towards the $150 level and formed a new monthly high at $149.
Later, there was a minor pullback below the $148 level. An initial support is near the $142 level and the 23.6% Fib retracement level of the last wave from the $118 low to $149 high. However, the key support is near the $137 level (the previous resistance and a pivot level). Moreover, there is a key bullish trend line formed with support at $134 on the 4-hours chart. The trend line coincides with the 50% Fib retracement level of the last wave from the $118 low to $149 high.
Therefore, if there is an extended bearish wave towards the $137 and $134 levels, buyers are likely to protect declines. If buyers fail to protect $134, the price could drop towards the main support at $124. An intermediate support is $130 and the 61.8% Fib retracement level of the last wave from the $118 low to $149 high.

Looking at the chart, Ethereum price is placed nicely in a solid uptrend above $134. Sooner or later, the price is likely to break the $149-150 resistance zone. The next target for buyers could be $160 and $162 (the previous swing high). A successful break above the $162 resistance will most likely set the pace for a push towards $175.
Technical indicators
4 hours MACD – The MACD for ETH/USD is gaining strength in the bullish zone.
4 hours RSI (Relative Strength Index) – The RSI for ETH/USD is currently in the overbought zone, with no bearish signal.
Key Support Levels – $137, followed by the $134 zone.
Key Resistance Levels – $150 and $160.
 livebitcoinnews.com