1inch (1INCH) has broken down from an ascending support line but bounced at the $2.25 support area.
Swipe (SXP) has created a double bottom pattern at the $1.70 support area.
Origin Protocol (OGN) is in the process of breaking out from a descending resistance line.
1INCH
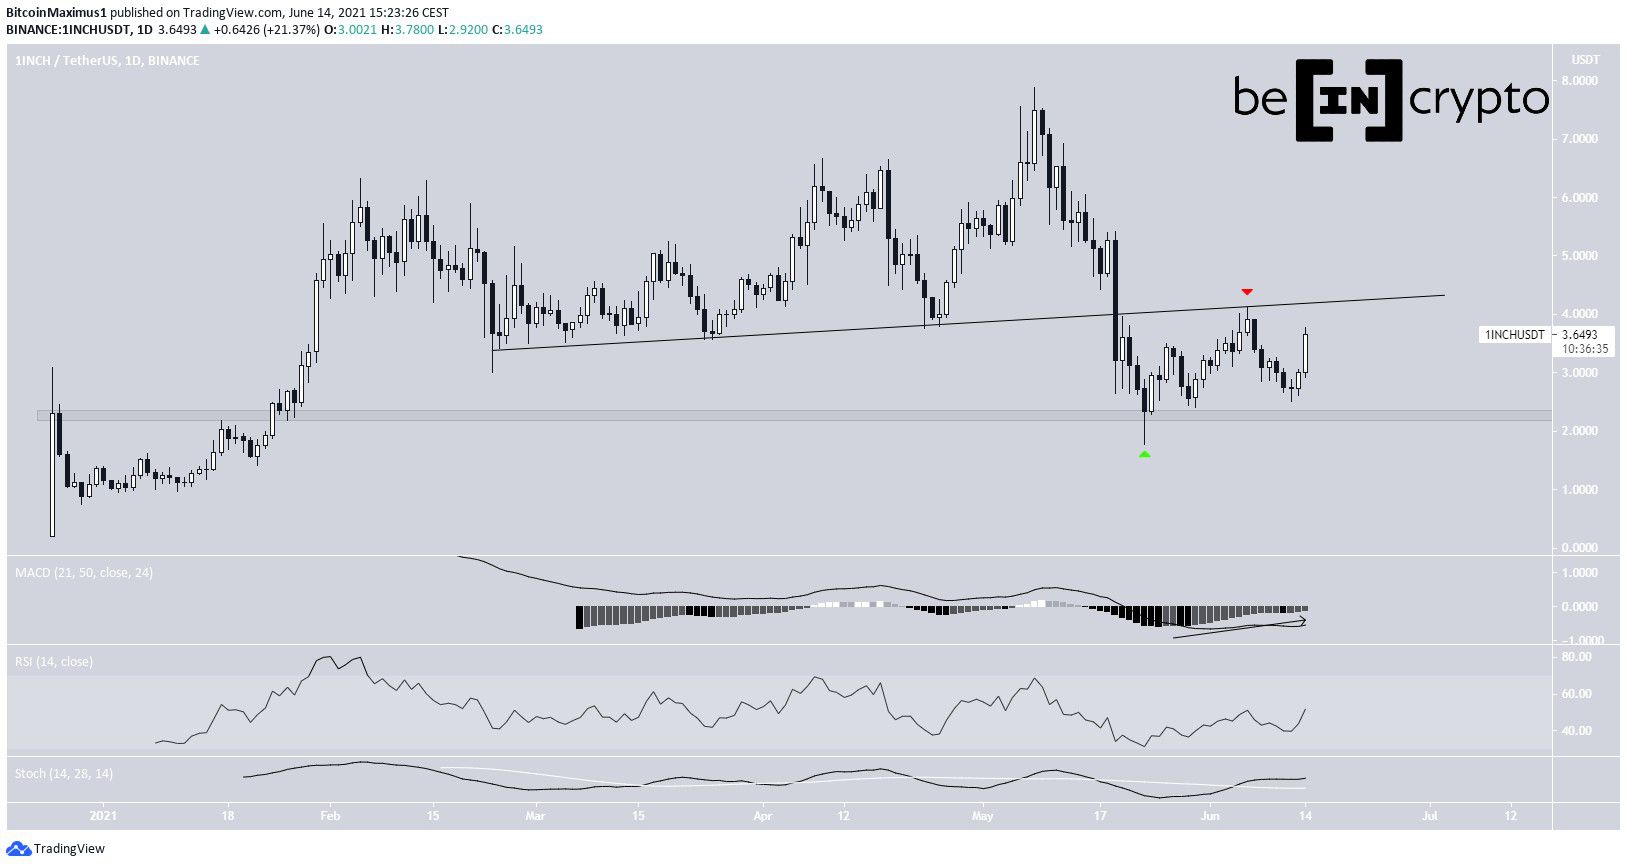
1INCH has been moving downwards since reaching an all-time high price of $7.87 on May 8. On May 19, it broke down from an ascending support line. The line then acted as resistance on June 6 (red icon).
So far, it has reached a low of $ on May 23, validating the $2.25 area as support. The same area previously acted as resistance in Dec. 2020. The token has been moving upwards since.
Technical indicators are showing some bullish signs, such as the increasing MACD and bullish cross in the Stochastic oscillator.
Nevertheless, until the token reclaims the ascending support line, we cannot consider the trend bullish.
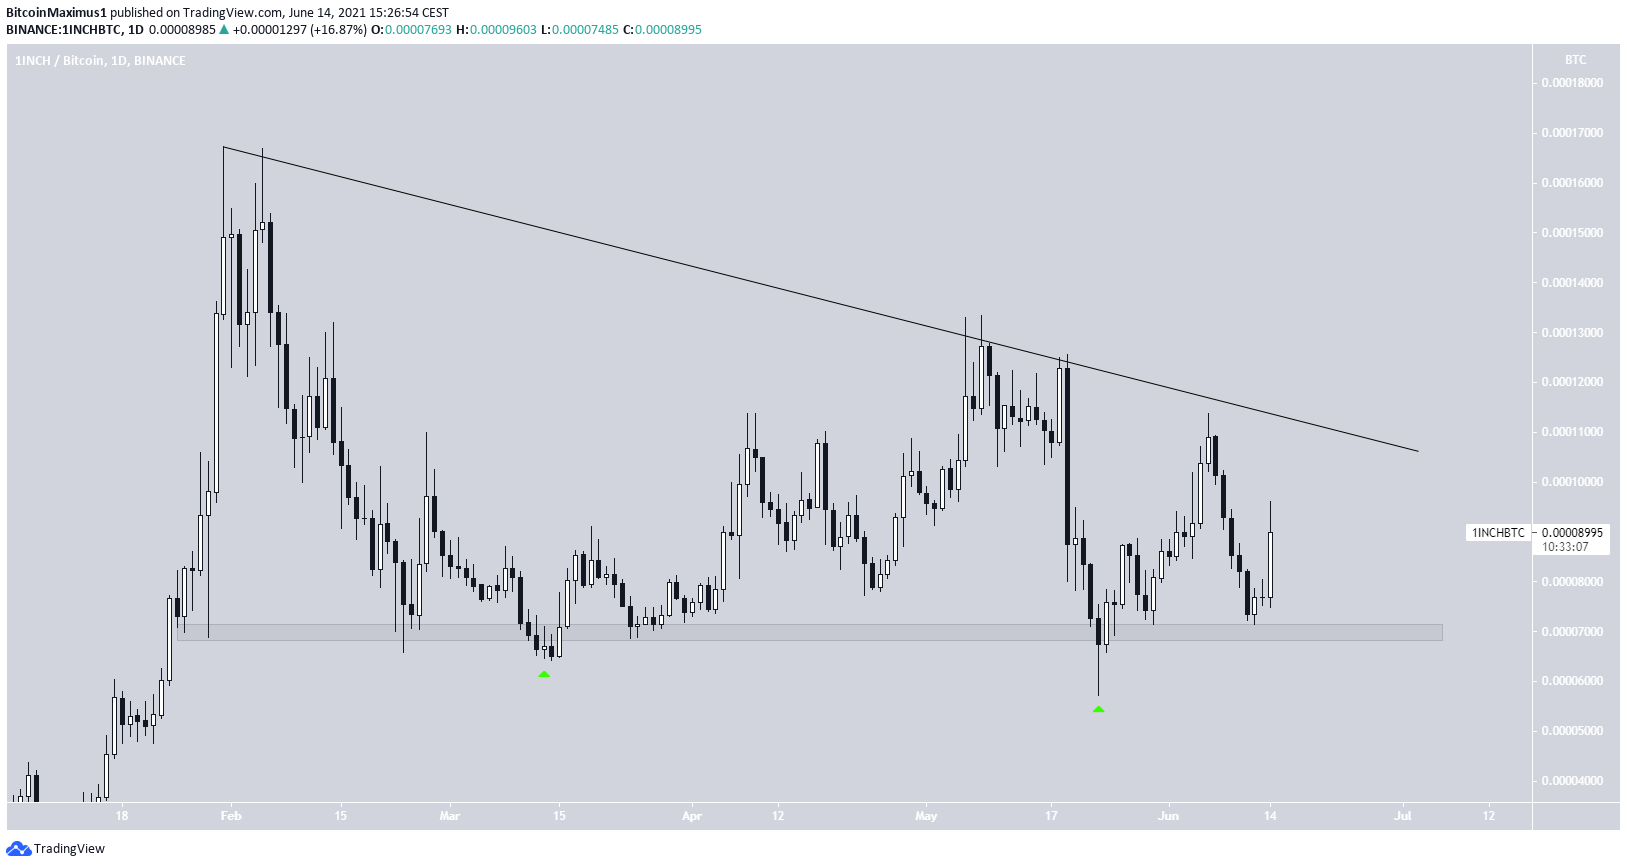
The 1INCH/BTC pair provides a similar picture. The token has bounced on May 23 and has been moving upwards since. On June 12, it created a higher low and has created a bullish candlestick on June 14.
Despite this, it is still following a descending resistance line. Until it breaks out, we cannot consider the trend bullish.
Highlights
- 1INCH has broken down from an ascending support line.
- 1INCH/BTC is following a descending resistance line.
SXP
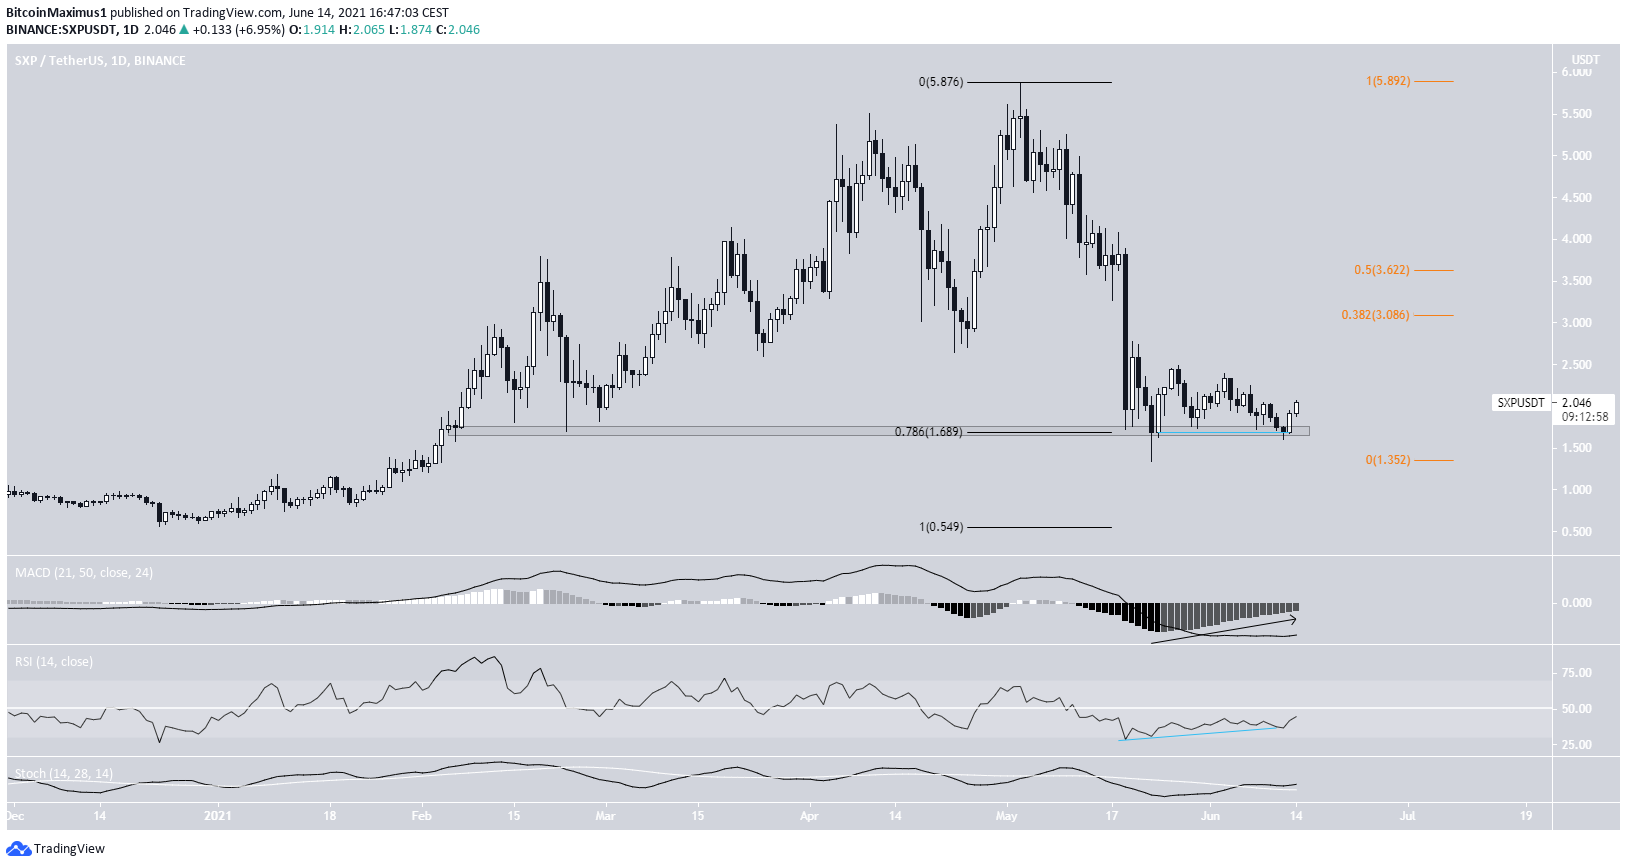
On May 23, SXP reached a low of $1.34 and bounced. The low was made at the $1.70 support area, which is the 0.786 Fib retracement support level.
On June 12, the token retraced to this area and made a slightly higher low. This created a potential double bottom, which is considered a bullish reversal pattern. In addition, it was combined with bullish divergence in both the RSI & MACD.
Therefore, SXP is likely to move upwards towards the next closest resistance areas at $3.08 and $3.62.
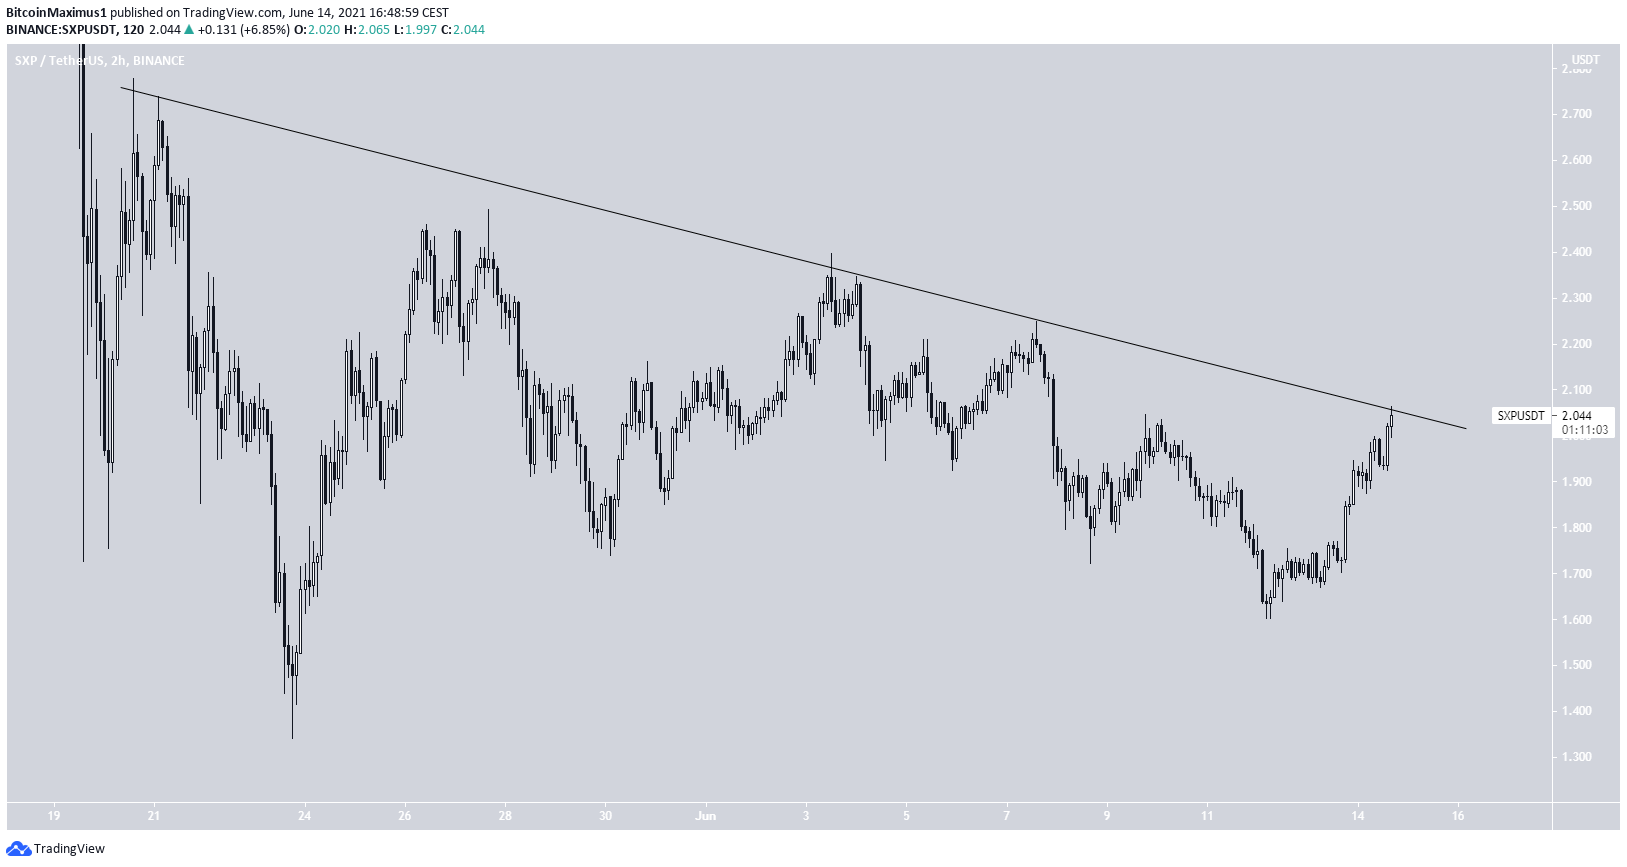
The shorter-term two-hour chart shows that SXP is following a descending resistance line. It is currently making its fifth breakout attempt.
The upward movement is likely to commence once SXP moves above this line.
Highlights
- SXP has created a double bottom
- It is following a short-term descending resistance line.
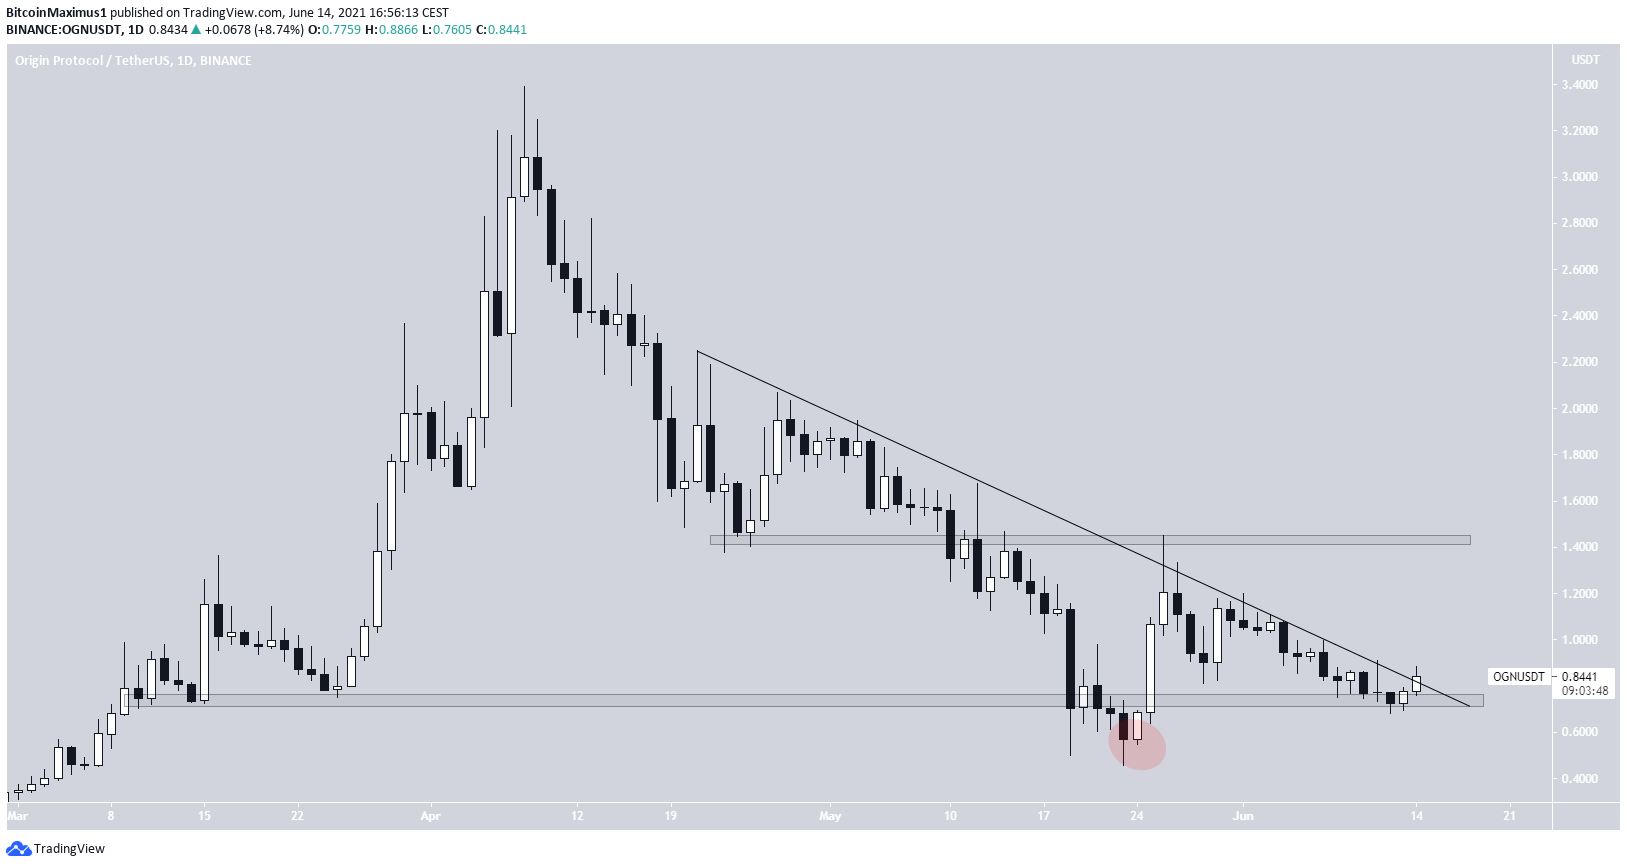
OGN
OGN has been following a descending resistance line since April 21. So far, it has made numerous unsuccessful breakout attempts. However, it is currently in the process of moving above this line.
The current upward movement began on May 23, once OGN reached a low of $0.45. Afterwards, it reclaimed the $0.73 support area, rendering the previous decrease as only a deviation (red circle). These occurrences are often followed with a significant movement in the other direction.
On June 12, OGN made a lower high and is now close to breaking out. If successful, the next resistance area would be at $1.43.
Highlights
- OGN is following a descending resistance line.
- There is support and resistance at $0.73 and $1.44.