Chiliz (CHZ) has been increasing at a slow pace since the end of May. It is currently approaching the first of two major resistance levels, a breakout above which could trigger a sharp upward movement.
Near Protocol (NEAR) is attempting to initiate a reversal at the previous all-time high level and has broken out from a short-term corrective pattern.
While Terra (LUNA) reached an all-time high price on Oct 4, it has broken down from its structure, putting its bullish trend in doubt.
CHZ
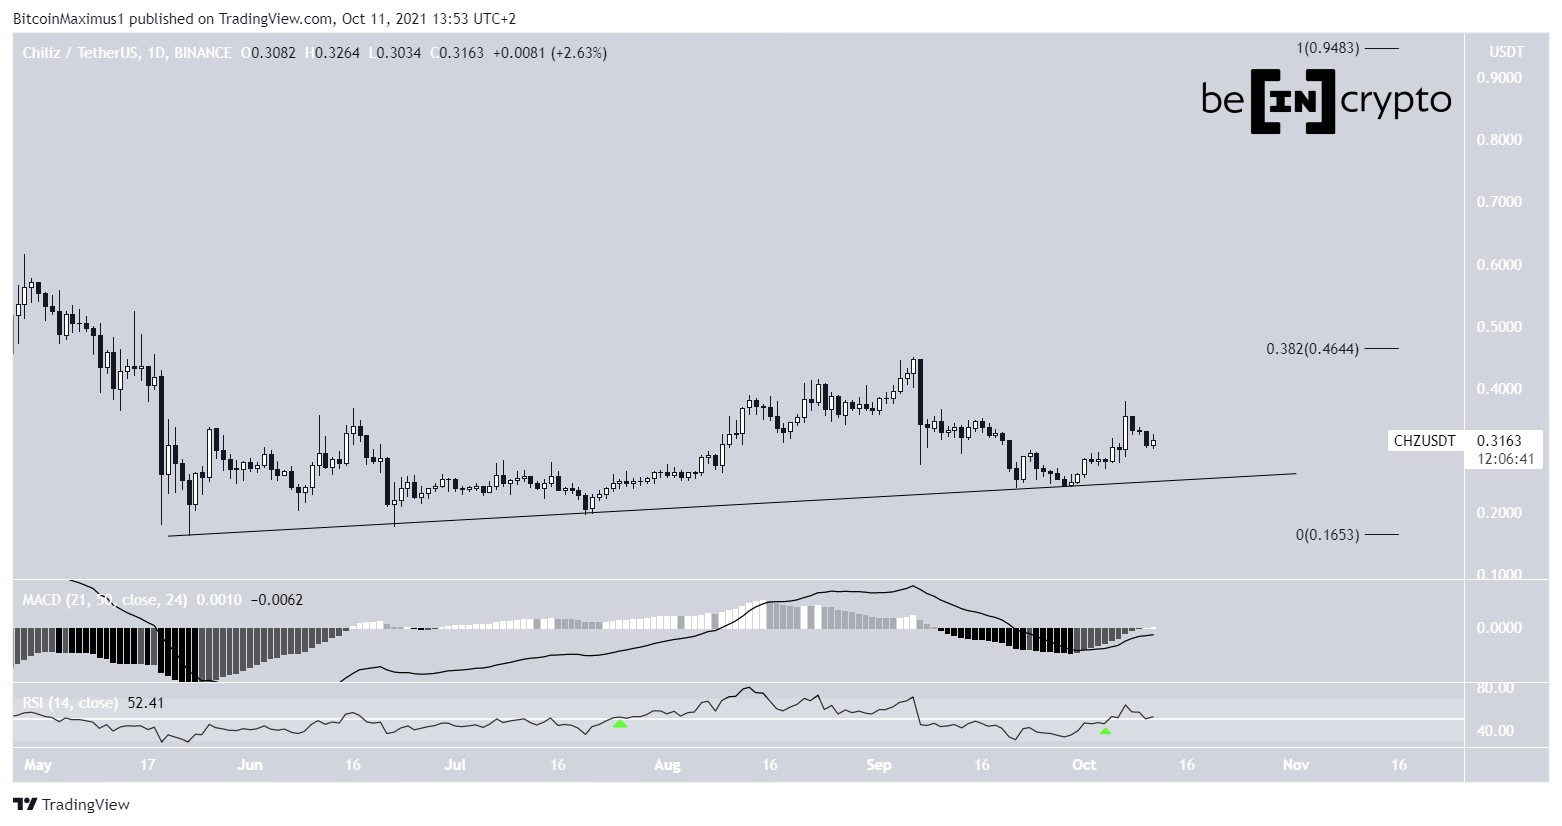
CHZ has been increasing alongside an ascending support line since May 23. As long as the support line is intact, the trend is bullish and increasing at the rate of the line.
The bullish trend is also supported by technical indicators, more specifically the MACD and RSI.
The MACD is increasing and has nearly crossed into positive territory. The indicator is created by a combination of short- and long-term moving averages (MA), and the reading means that the short-term trend is gaining on the long-term one, but has yet to surpass it.
On the other hand, the RSI has already moved above the 50 line (Green icon). This often means that the trend is bullish. The previous time it occurred was on July 24, preceding the upward movement to $0.46.
The main resistance is at $0.465. It is created by the 0.382 Fib retracement resistance level and the Sept highs. If CHZ manages to move above it, it could increase considerably.
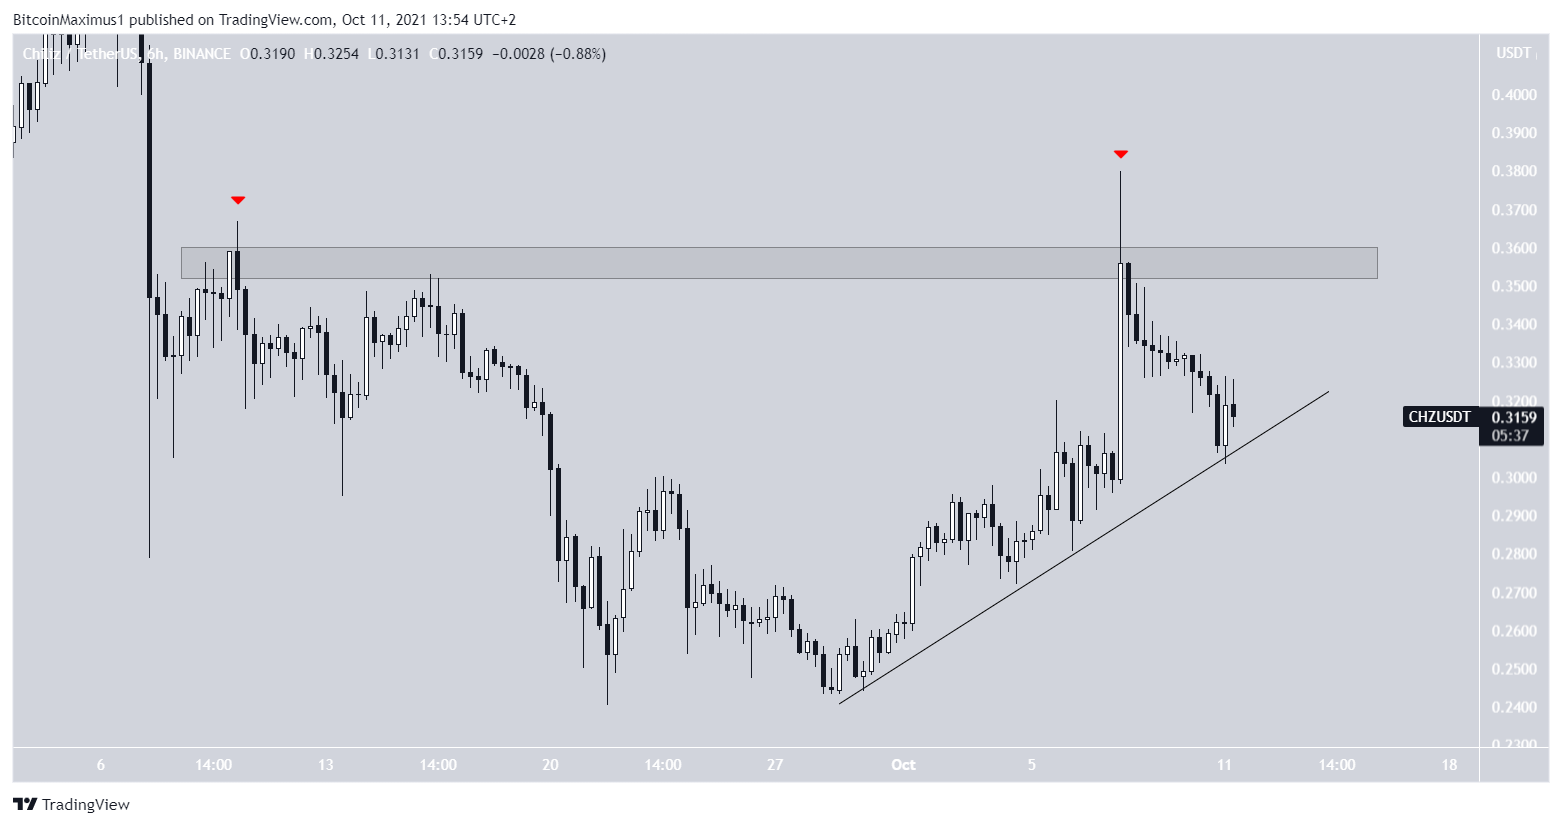
The shorter-term six-hour chart shows that CHZ is following an even steeper ascending support line. This led to the $0.38 high on Oct 7.
However, the higher prices could not be sustained, and the token created a long upper wick (red icon). The wick is considered a sign of selling pressure, since the higher prices could not be sustained.
Furthermore, it validated the $0.355 area as resistance, since the same area rejected CHZ on Sept 10.
Therefore, there are two resistance levels left to clear so CHZ can begin a considerable upward movement.
Highlights
- CHZ is following an ascending support line.
- There is resistance at $0.355 and $0.465.
NEAR
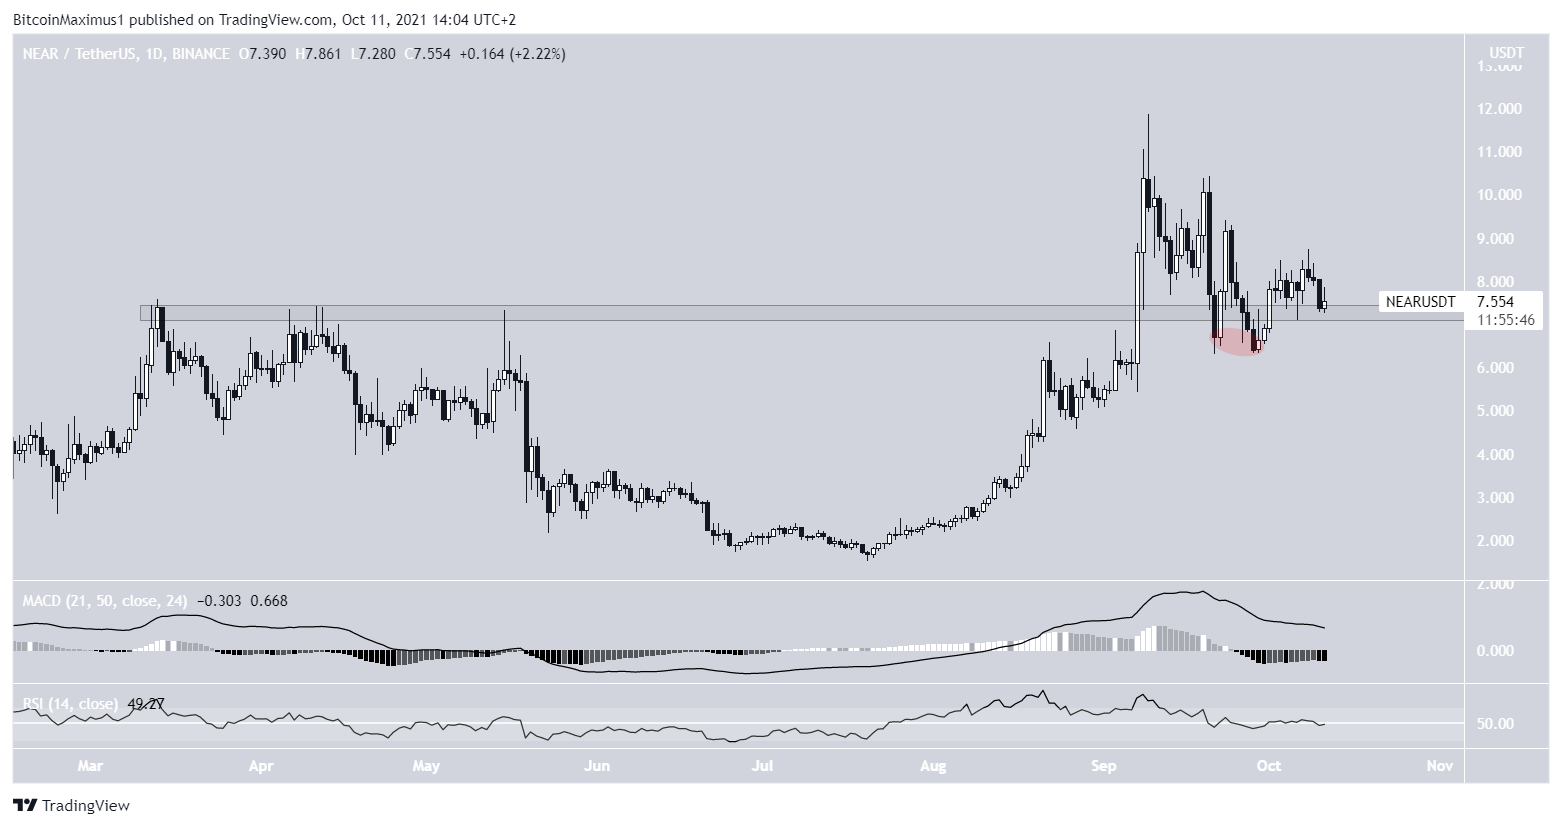
NEAR has been falling since Sept 7, when it reached an all-time high price of $11.88. Initially, the drop caused it to fall below the $7.30 area. This is a crucial area, since it was the previous all-time high resistance and is now expected to act as support.
However, after deviating below the area (red circle), NEAR bounced and reclaimed the level. This is a bullish occurrence that often preceded sharp movements in the other direction.
Technical indicators provide a neutral outlook. The MACD is decreasing, but it is still positive. As stated above, this means that while the short-term trend is still faster than the long-term one, it is rapidly losing ground.
On the other hand, the fact that the RSI is right at the 50 line is a very neutral reading.
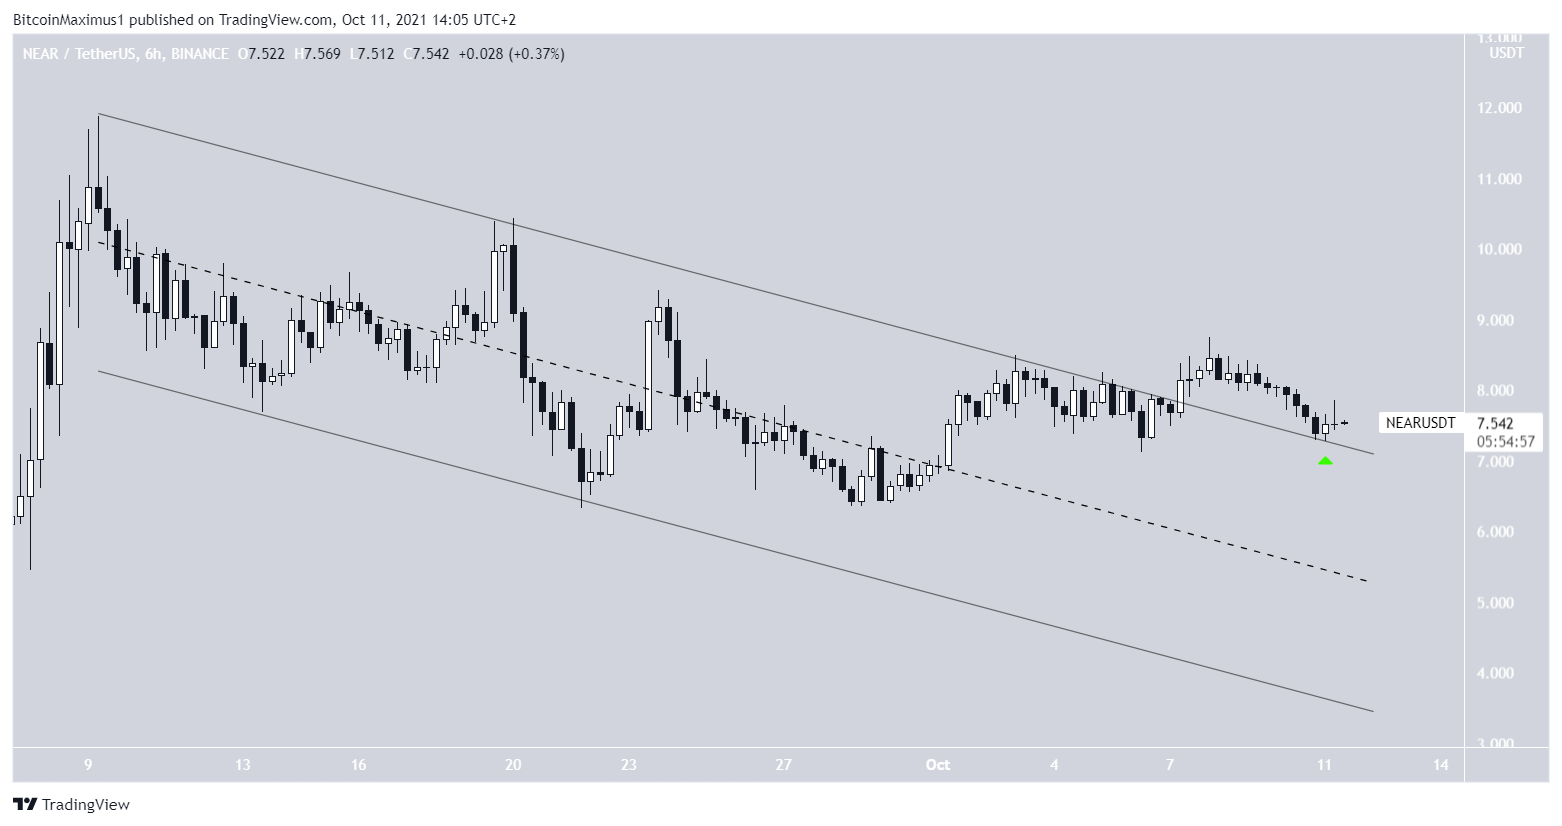
The shorter-term six-hour chart supports the possibility that the token will break out.
NEAR has broken out from a descending parallel channel and validated it as support afterwards (green icon).
Parallel channels usually contain corrective movements. The breakout from the channel indicates that the correction is complete and NEAR is likely to resume its upward movement.
Highlights
- NEAR reached an all-time high price on Sept 9.
- It is trading above support at $7.30.
LUNA
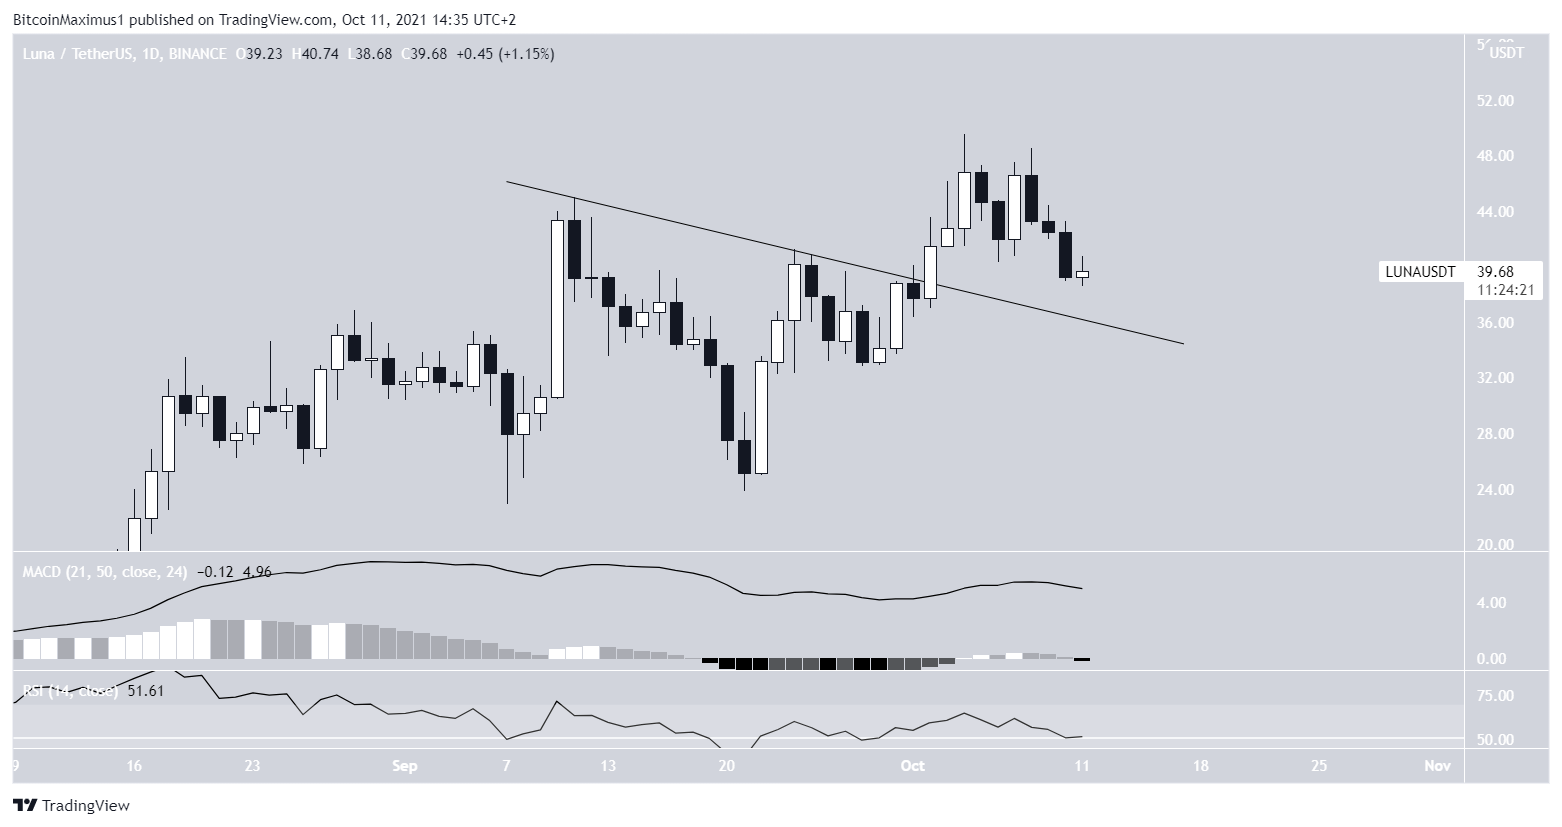
LUNA has been decreasing since reaching an all-time high of $49.54 on Oct 5.
It is possibly trying to find support above a descending resistance line from which it previously broke out.
The RSI and MACD readings are the same as those for NEAR. The MACD shows that the short-term trend is losing strength, though is still faster than the long-term one. The RSI is neutral.
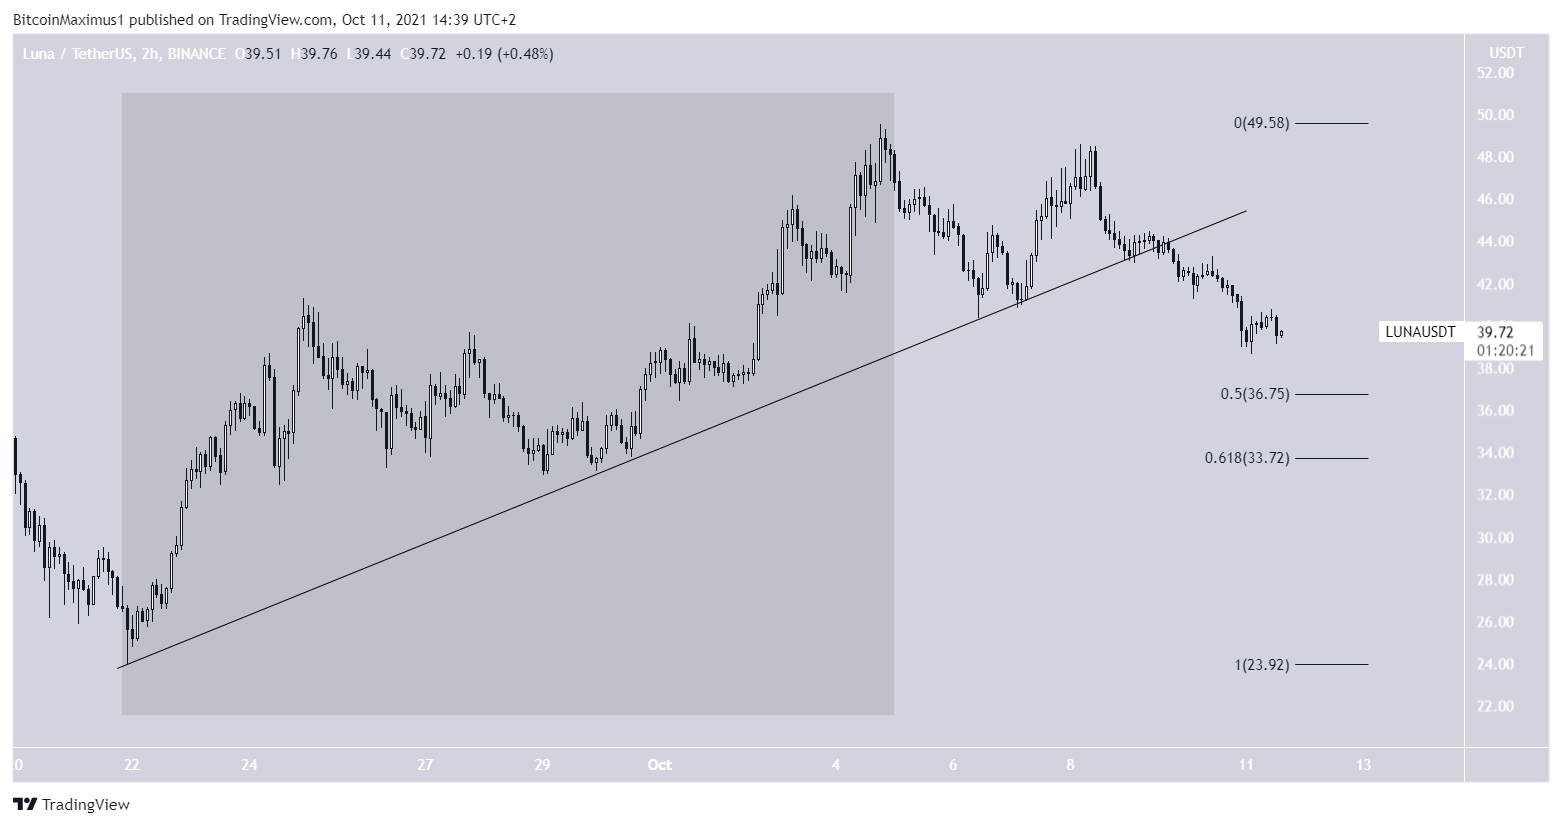
The shorter-term two-hour chart casts some doubt on the possibility that LUNA will continue to increase.
Firstly, the token has broken down from an ascending support line. Secondly, the upward movement that led to the all-time high is a three wave structure (highlighted). If this were the beginning of a long-term upward movement, the increase should have been a five wave structure.
There is support at $36.75 and $33.75, the 0.5 and 0.618 Fib retracement support levels. However, while they are likely to provide temporary support, the possibility of a bullish reversal cannot be determined.
Highlights
- LUNA reached an all-time high price on Oct 5.
- It has broken down from an ascending support line.