Bitcoin saw a very sharp 11% price drop over the past 24-hours of trading as the cryptocurrency fell as low as $46,000 earlier today.
The primary cryptocurrency had been trading at a high above $58,000 yesterday but started to drop sharply from the $54-55K region following news that Tesla stopped accepting BTC as payments for their electric vehicles.
Along with the fundamental cause, the cryptocurrency had also broken beneath a rising wedge formation a day before this, as mentioned in our most recent bitcoin analysis. The violent sell-off had accomplished the mentioned target of $46-47K, which was also the monthly lows reached in April.
Despite the bearishness, bitcoin is now facing a critical short-term decision.
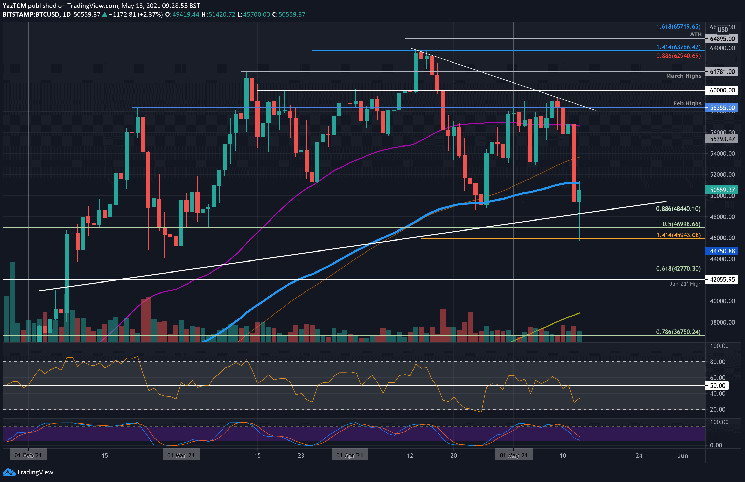
Earlier today, following the drop to $46k, bitcoin saw a decent rebound of over $5K before retracing to around the $50k levels (as of now). The coin is currently battling to remain above an ascending trend line that dates back to February 2021 and forms a hammer candlestick pattern that could help to stall any further declines if today’s closing candle closes like this. The latter is the optimistic option.
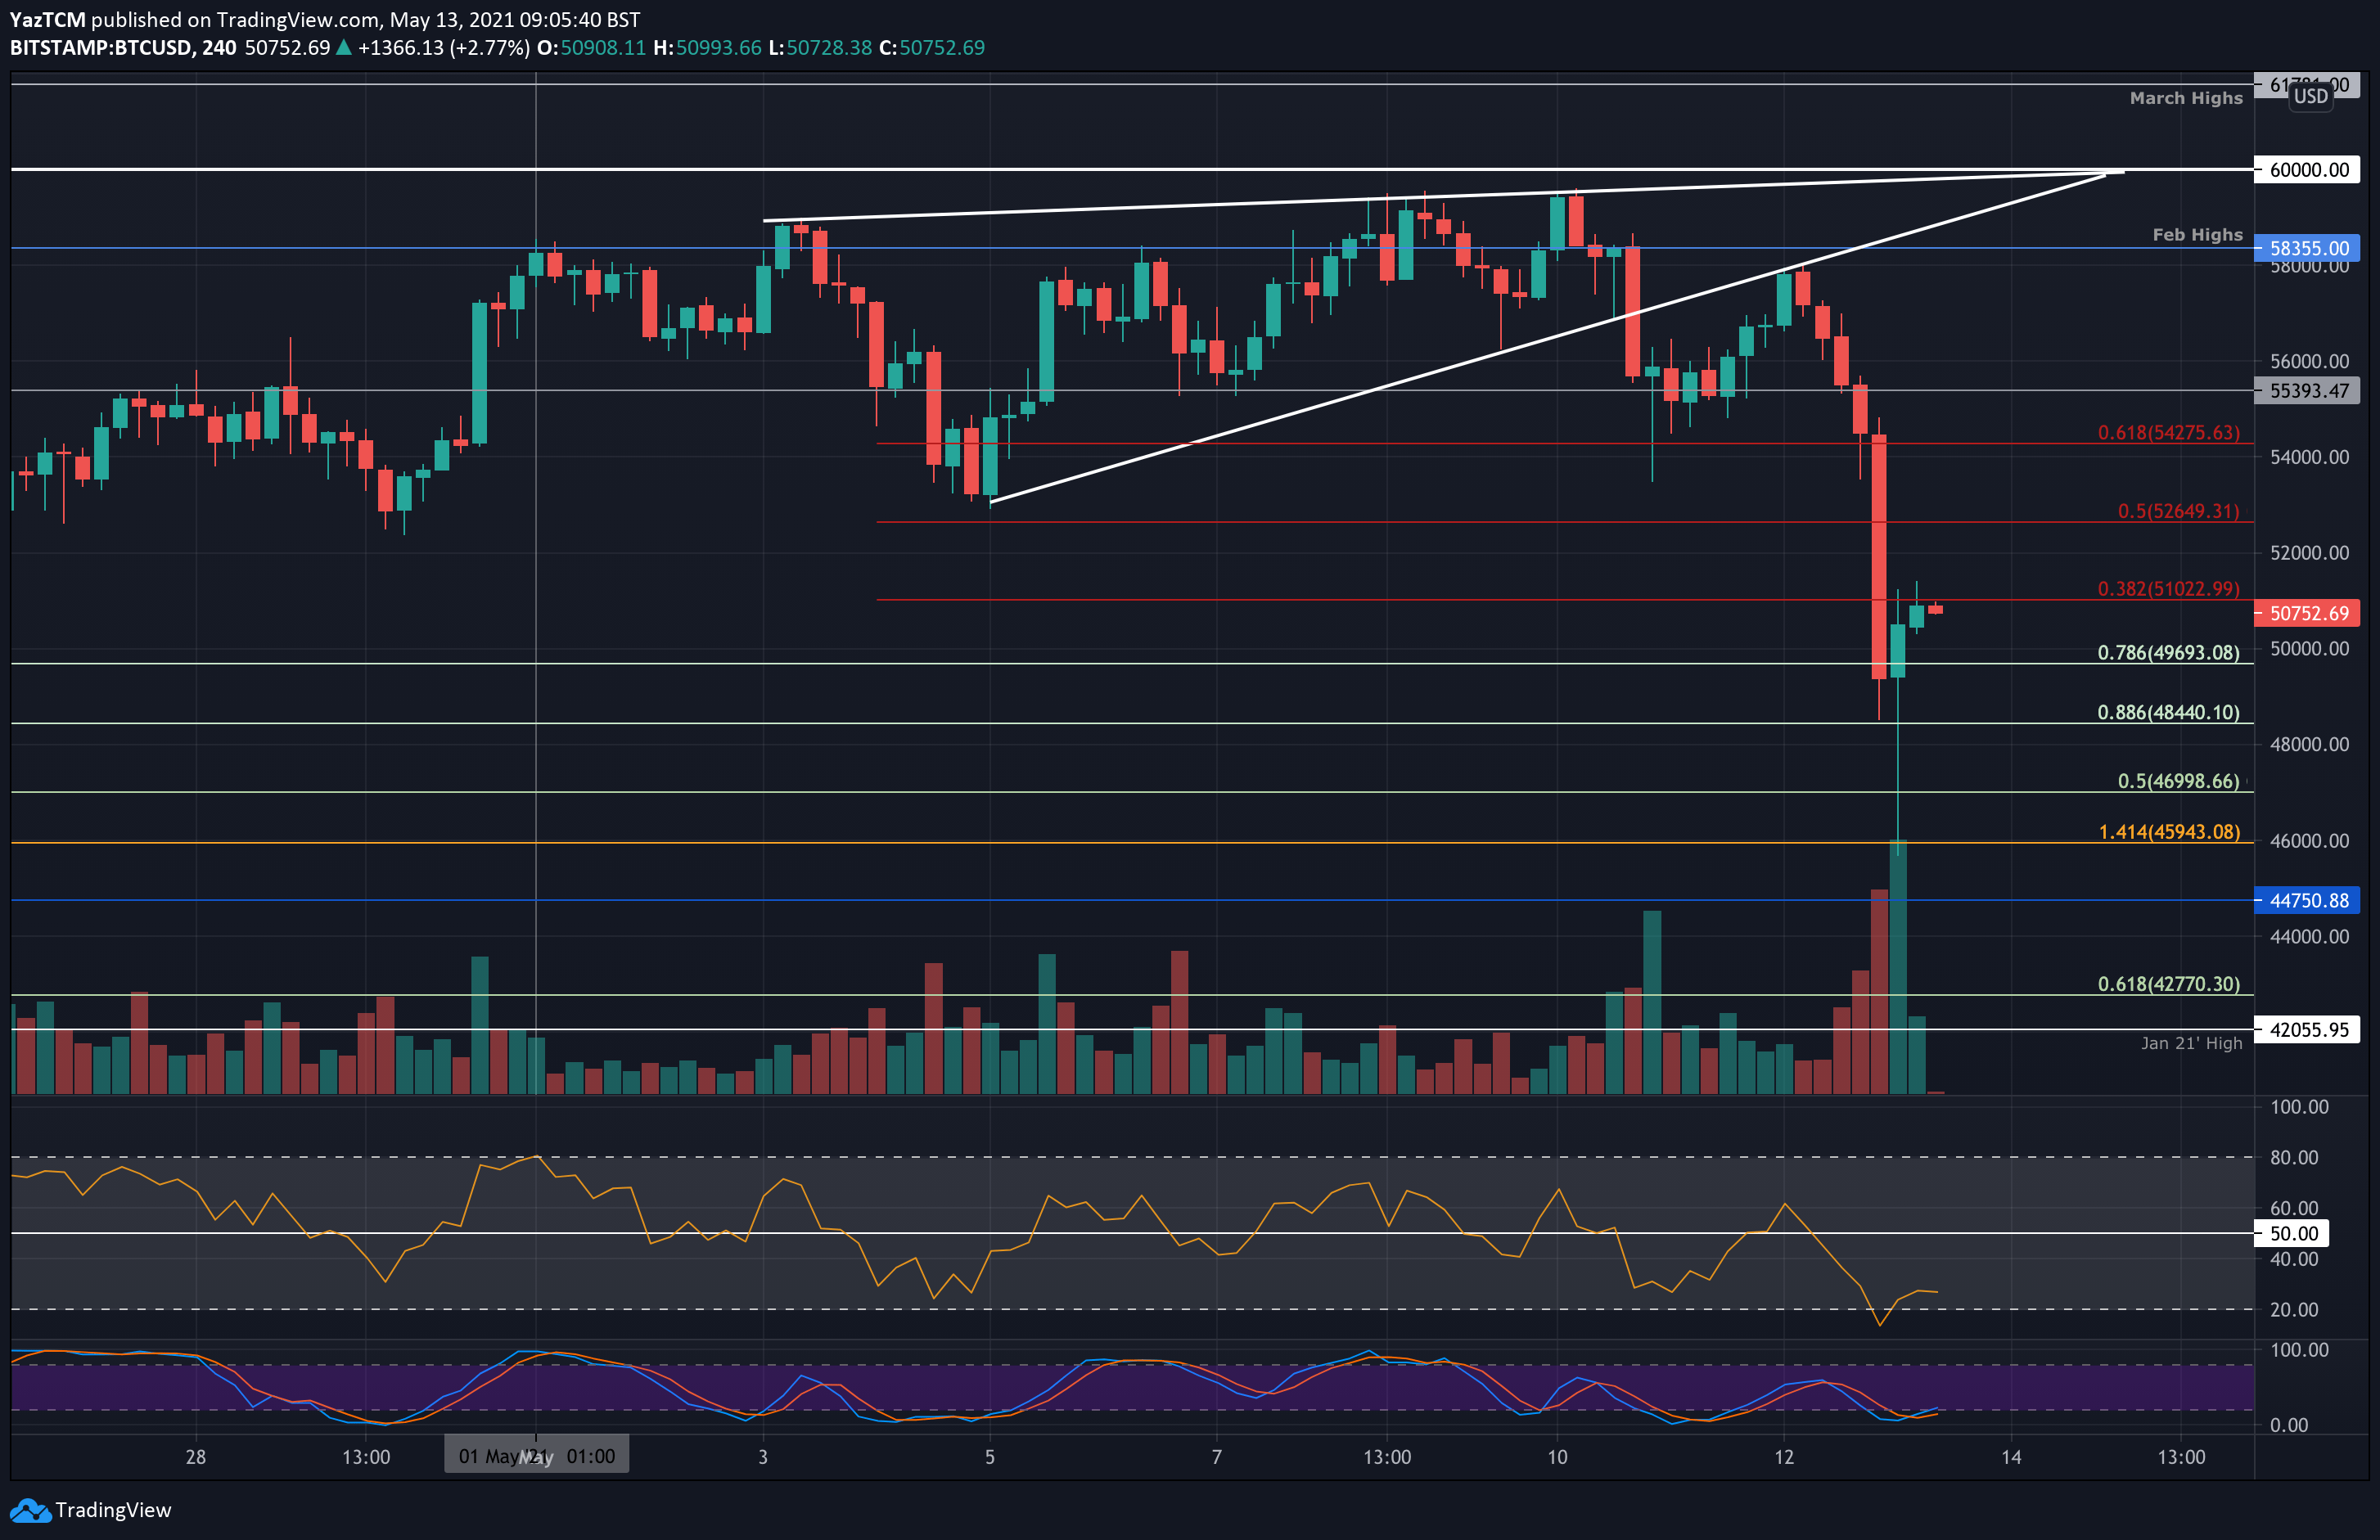
On the other hand, BTC had lost the significant 100-day EMA level at $51,000, and this has now turned into solid resistance moving forward. This resistance is also the short-term bearish .382 Fib from the recent sell-off – best seen in the following 4-hour chart.
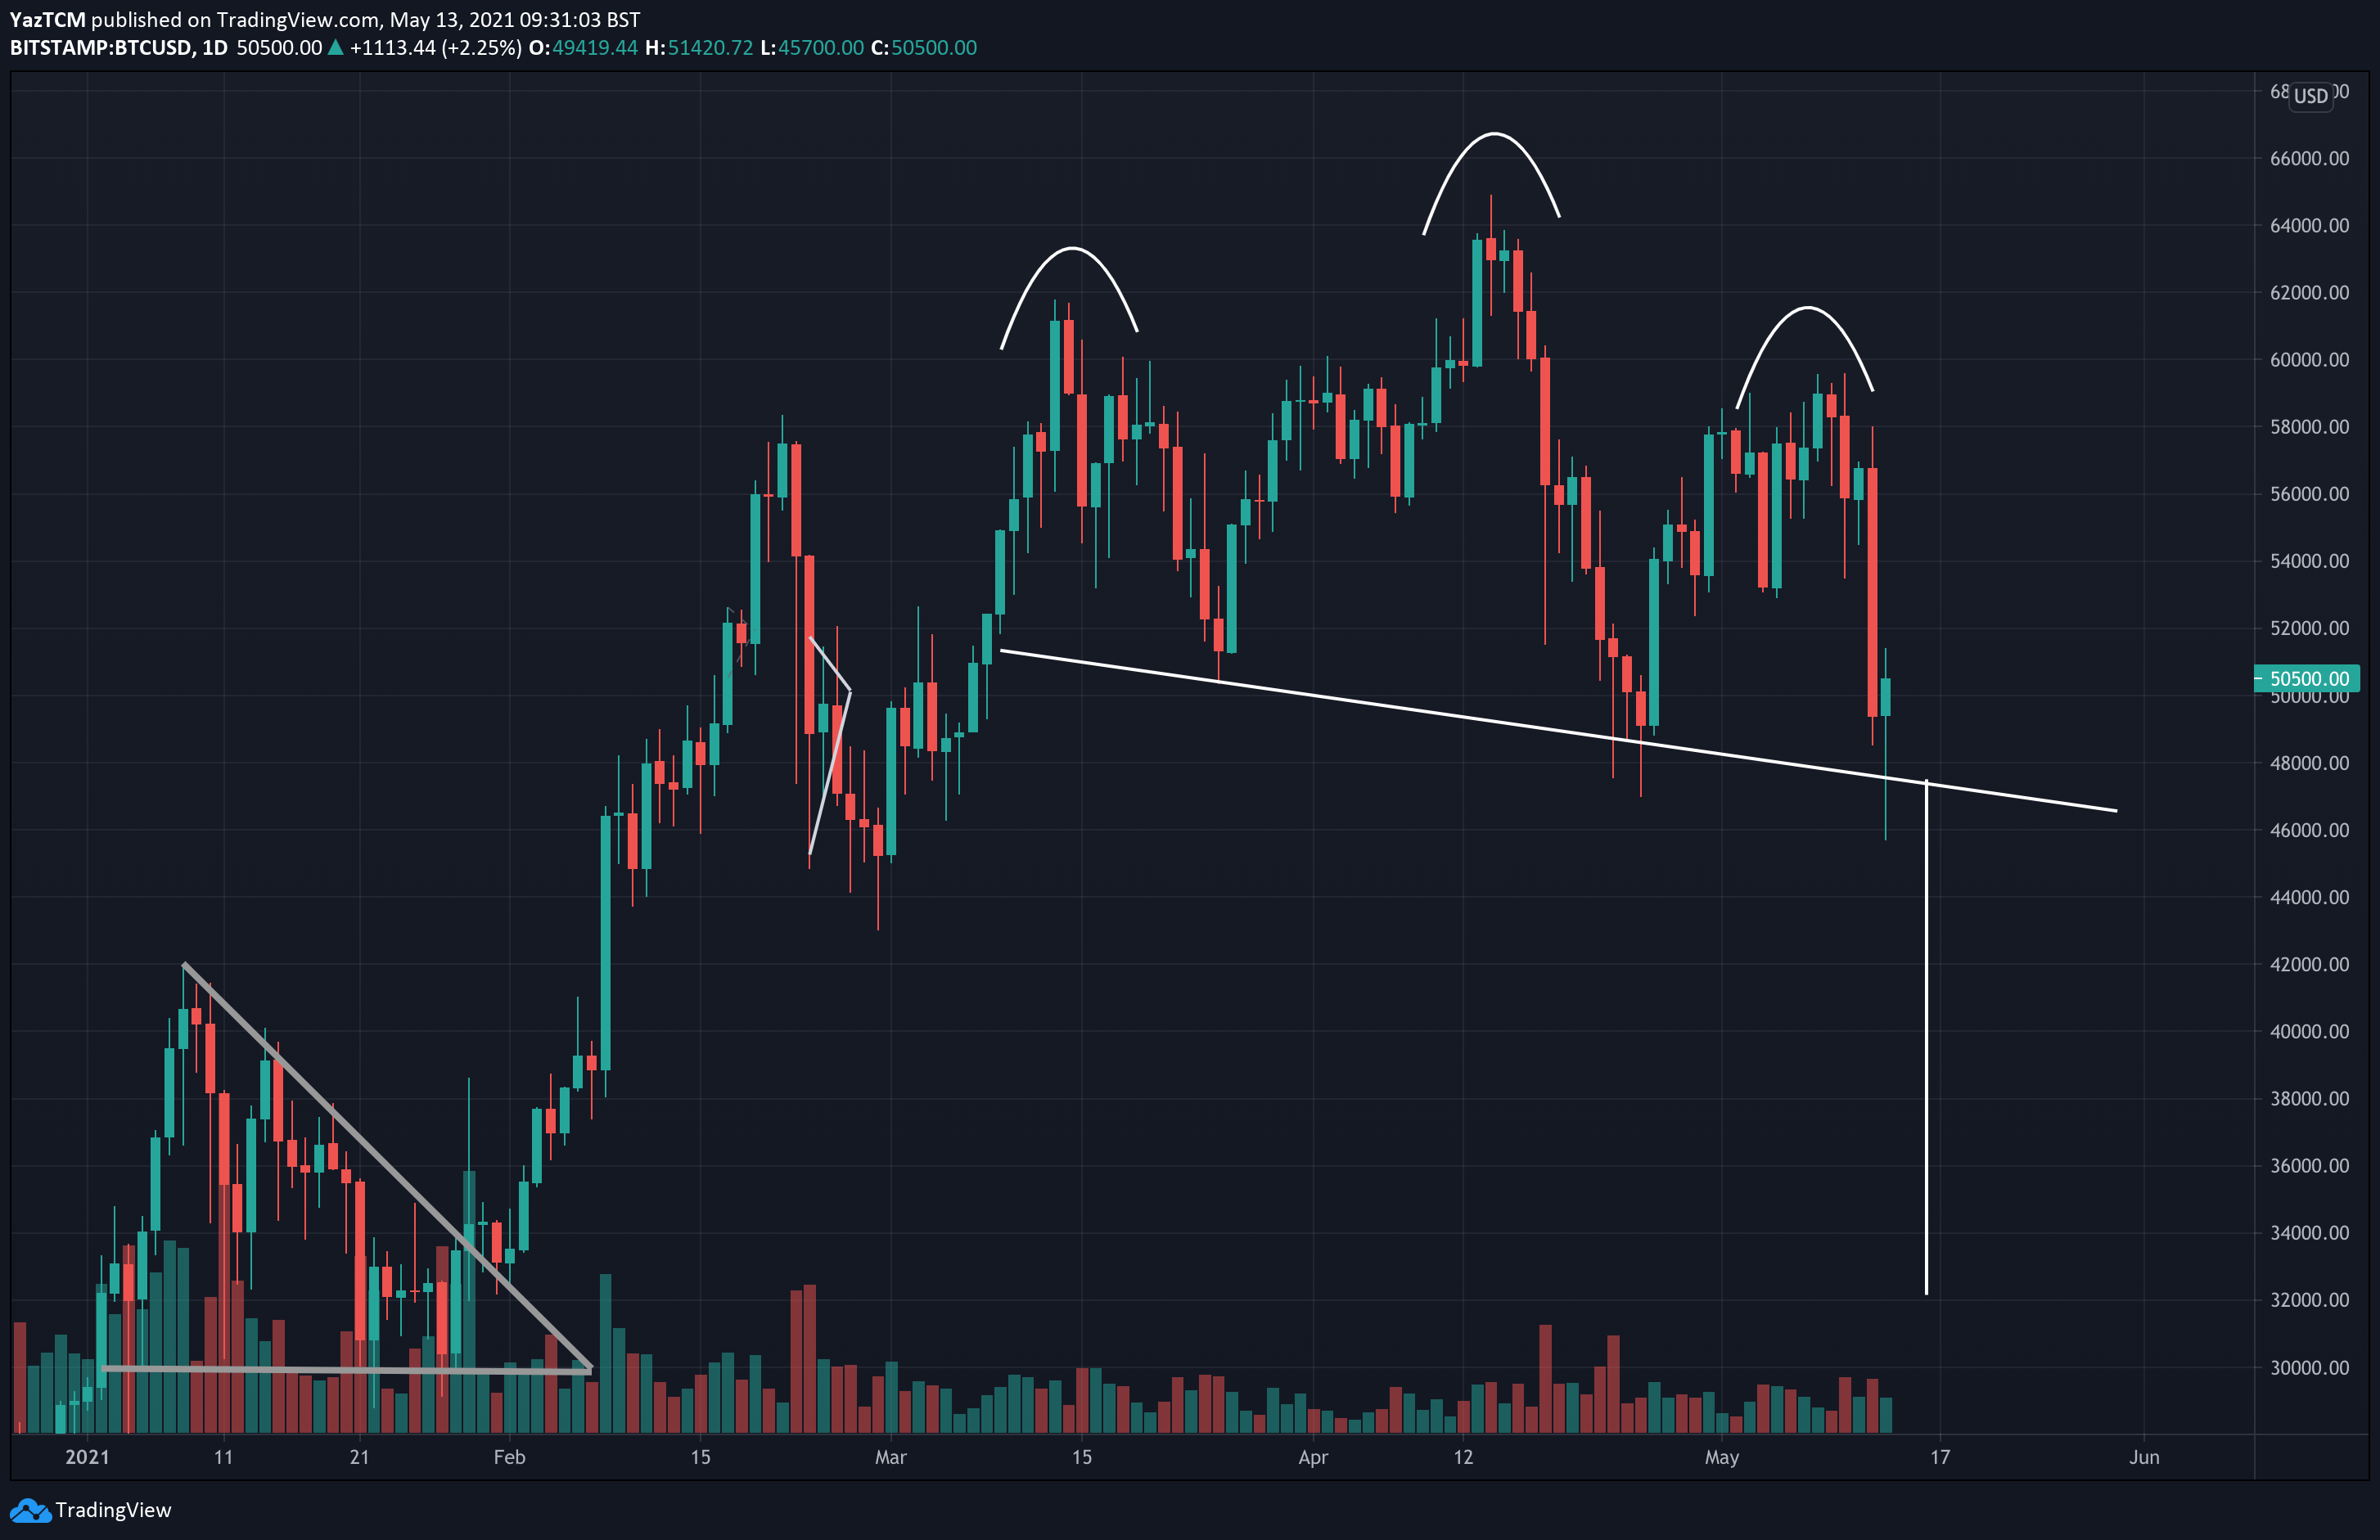
In addition, bitcoin has now formed a large head and shoulders pattern, dated from March. A break beneath the neckline of this pattern, which lies around the $48.5k support, could see BTC potentially heading as low as $32,000, which is the target of the bearish H&S pattern.
BTC Price Support and Resistance Levels to Watch
Key Support Levels: $50,000, $48,450, $47,000, $46,000, $44,750.
Key Resistance Levels: $51,000, $52,650, $53,700, $54,725, $56,660.
Looking ahead, the first support lies at $50,000. Beneath this, support is expected at $48,450 (.886 Fib), $47,000 (long term .5 Fib), $46,000 (today’s low), and $44,750. Further support is found at $42,770 (long term .618 Fib), and $42,000 (January 2021 highs).
On the other side, the first major resistance lies at today’s current high of $51,000 (100-day EMA & short term bearish .382 Fib). This is followed by $52,650 (bearish .5 Fib), $53,700 (100-day MA), $54,275 (bearish .618 Fib), and $56,650 (50-day MA).
The RSI is beneath the midline as the bears take control of the market momentum. However, it is still far from being extremely oversold – indicating that there is still room for the bears to push further toward the downside before becoming exhausted.
Bitstamp BTC/USD Daily Chart
Bitstamp BTC/USD Daily Chart: Head & Shoulders Pattern
Bitstamp BTC/USD 4-Hour Chart