But could picking the top in the powerfully trending cryptocurrency really be easy as Pi?
Pi Cycle Top Indicator Says It’s Game Over For Currency Crypto Market Cycle
Bitcoin price is clearly at an inflection point. After rising from $4,000 to more than $60,000 per coin in under a year, the uptrend has taken a long pause, sticking around the resistance level for several weeks now. Technical indicators are and have been extremely overheated; volume and volatility are dropping. All signs are pointing to a sizable correction, yet fundamentals in crypto are the strongest ever.
RELATED READING | BITCOIN WEEKLY MOMENTUM INDICATOR FLIPS BEARISH FOR FIRST TIME SINCE 2020
Even the most bullish on the industry are suddenly finding themselves wondering if a top of the current cycle could be in – even if if the market isn’t behaving like a normal top. Signs are mounting by the day, but picking a peak in each Bitcoin cycle isn’t easy. Or is it?
According to a highly cited “Pi Cycle Top Indicator” on TradingView, the highly accurate tool was able to just about perfectly call all three previous Bitcoin tops – and it has just appeared again with last night’s weekly close.
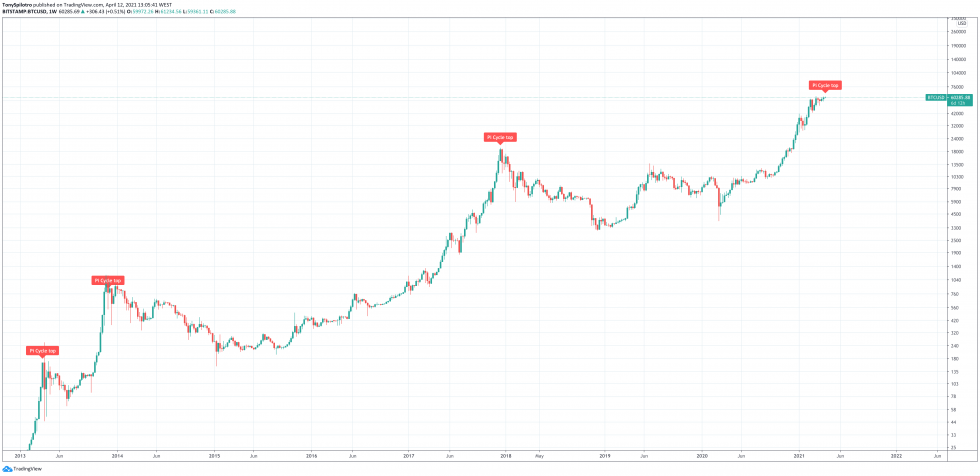
The Pi Cycle Top indicator has given its only fourth ever signal in Bitcoin | Source: BTCUSD on TradingView.com
Bitcoin Market Cycles Tell A Tale Of A An Ultimately Bullish Endgame
Each time in the past, the signal has marked the peak of each cycle on higher timeframes. If the Pi Cycle Top Indicator goes four out of four for picking Bitcoin peaks, that doesn’t mean all is lost for the first ever cryptocurrency.
The most recent peak in 2017 saw the signal appear just one day ahead of the high for the cycle, and was within striking distance from the high. Very few moments passed between the time the signal appeared and the exact high.
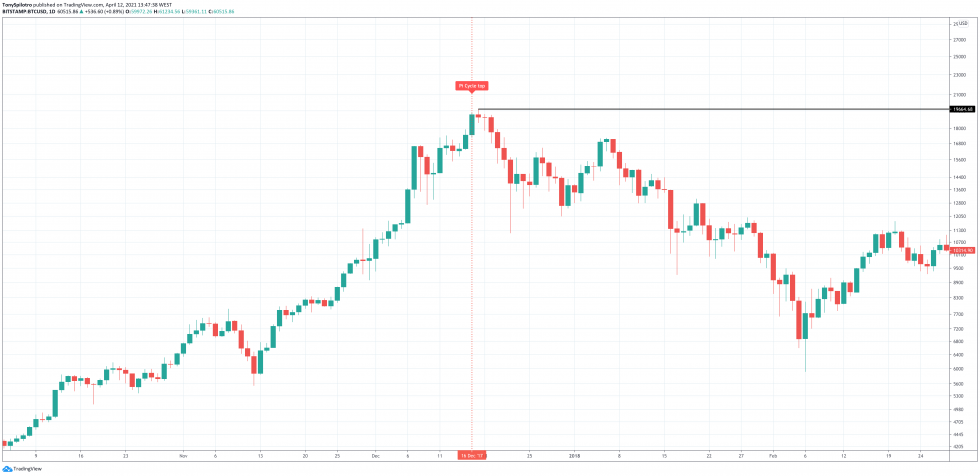
The 2017 "bubble pop" was a near flawless call | Source: BTCUSD on TradingView.com
In 2013, the Pi Cycle Top Indicator missed the exact top, instead appearing on the second “double top” formation, before entering the longest bear market yet.
RELATED READING | STOCK-TO-FLOW CREATOR: BITCOIN CYCLE “NOWHERE NEAR THE TOP”
The anomaly that’s in bull’s favor, is the first 2013 peak. The signal arrived too early, and the trending crypto asset surged another 85% after the indicator said the top was in.
When the first ever cryptocurrency did eventually peak, it saw an enormous rejection, sending the price tumbling a full 82% in four days. Yes, only four days. An 80% correction in four days would see Bitcoin back at $12,000 for a brief point in time.
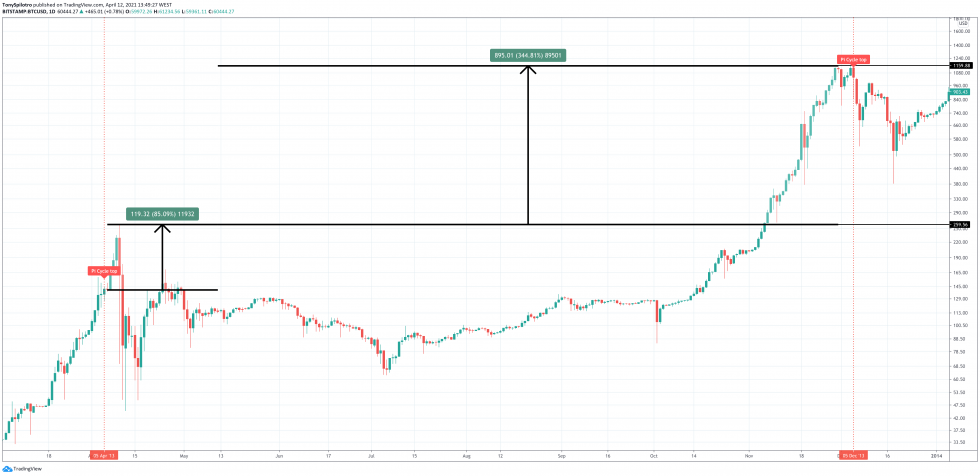
In 2013, Bitcoin kept going before an 82% correction. Then it did another 3-4x | Source: BTCUSD on TradingView.com
Considering the strong fundamentals and presence of institutional investors, anything that severe of a drop would likely be bought up in a fury, much like it was on Black Thursday just one year ago. Such a strong correction could purge all overheated indicators, shake out any remaining weak hands, and reignite interest for another more powerful leg up.
The Pi Cycle Top Indicator appearing in that case, wouldn’t be all that bad. If another 2013-like scenario plays out, Bitcoin would see a stomach-churning correction any day that would most certainly have the market thinking the peak was in.
If buyers stepped back in like they did in 2013, after short-term bottom Bitcoin rocketed back up another three to four times in price beyond the previous year’s high. In a similar scenario, the leading crypto asset could correct, but then after getting back above $60,000, would eventually see more than $100,000 per coin – a target that is more in line with analyst expectations.
Interestingly, the first 2013 Pi signal took place in April of that year, within two days from the signal appearing in 2021. Whatever the case may be, volatility is about to pick up in Bitcoin just as this top signal has appeared. Knowing all the past scenarios, which is the most probable to occur? Or is this time just pain different?
Featured image from Deposit Photos, Charts from TradingView.com