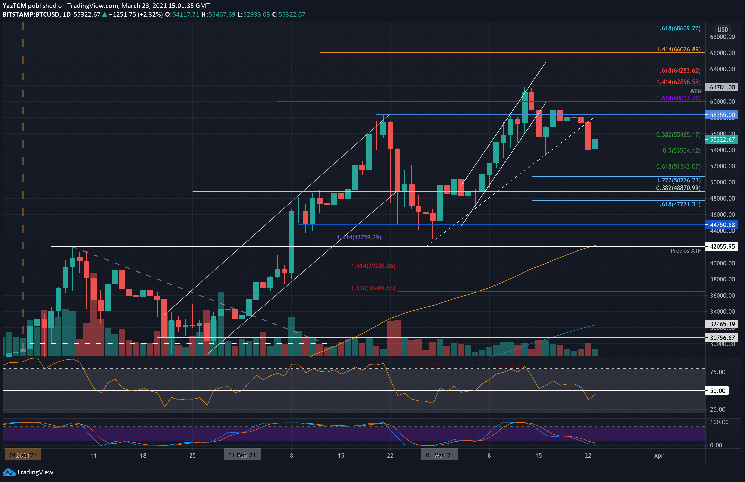
Bitcoin dropped by a sharp 3% today as the cryptocurrency falls to the current $55,000 level. It attempted to break above $60,000 over the weekend but it failed to close a daily candle above $58,355. As a result, BTC slipped from $58,300 yesterday and fell beneath the March ascending trend line to reach as low as $53,700. It rebounded by the end of the day to close the candle at $54,000.
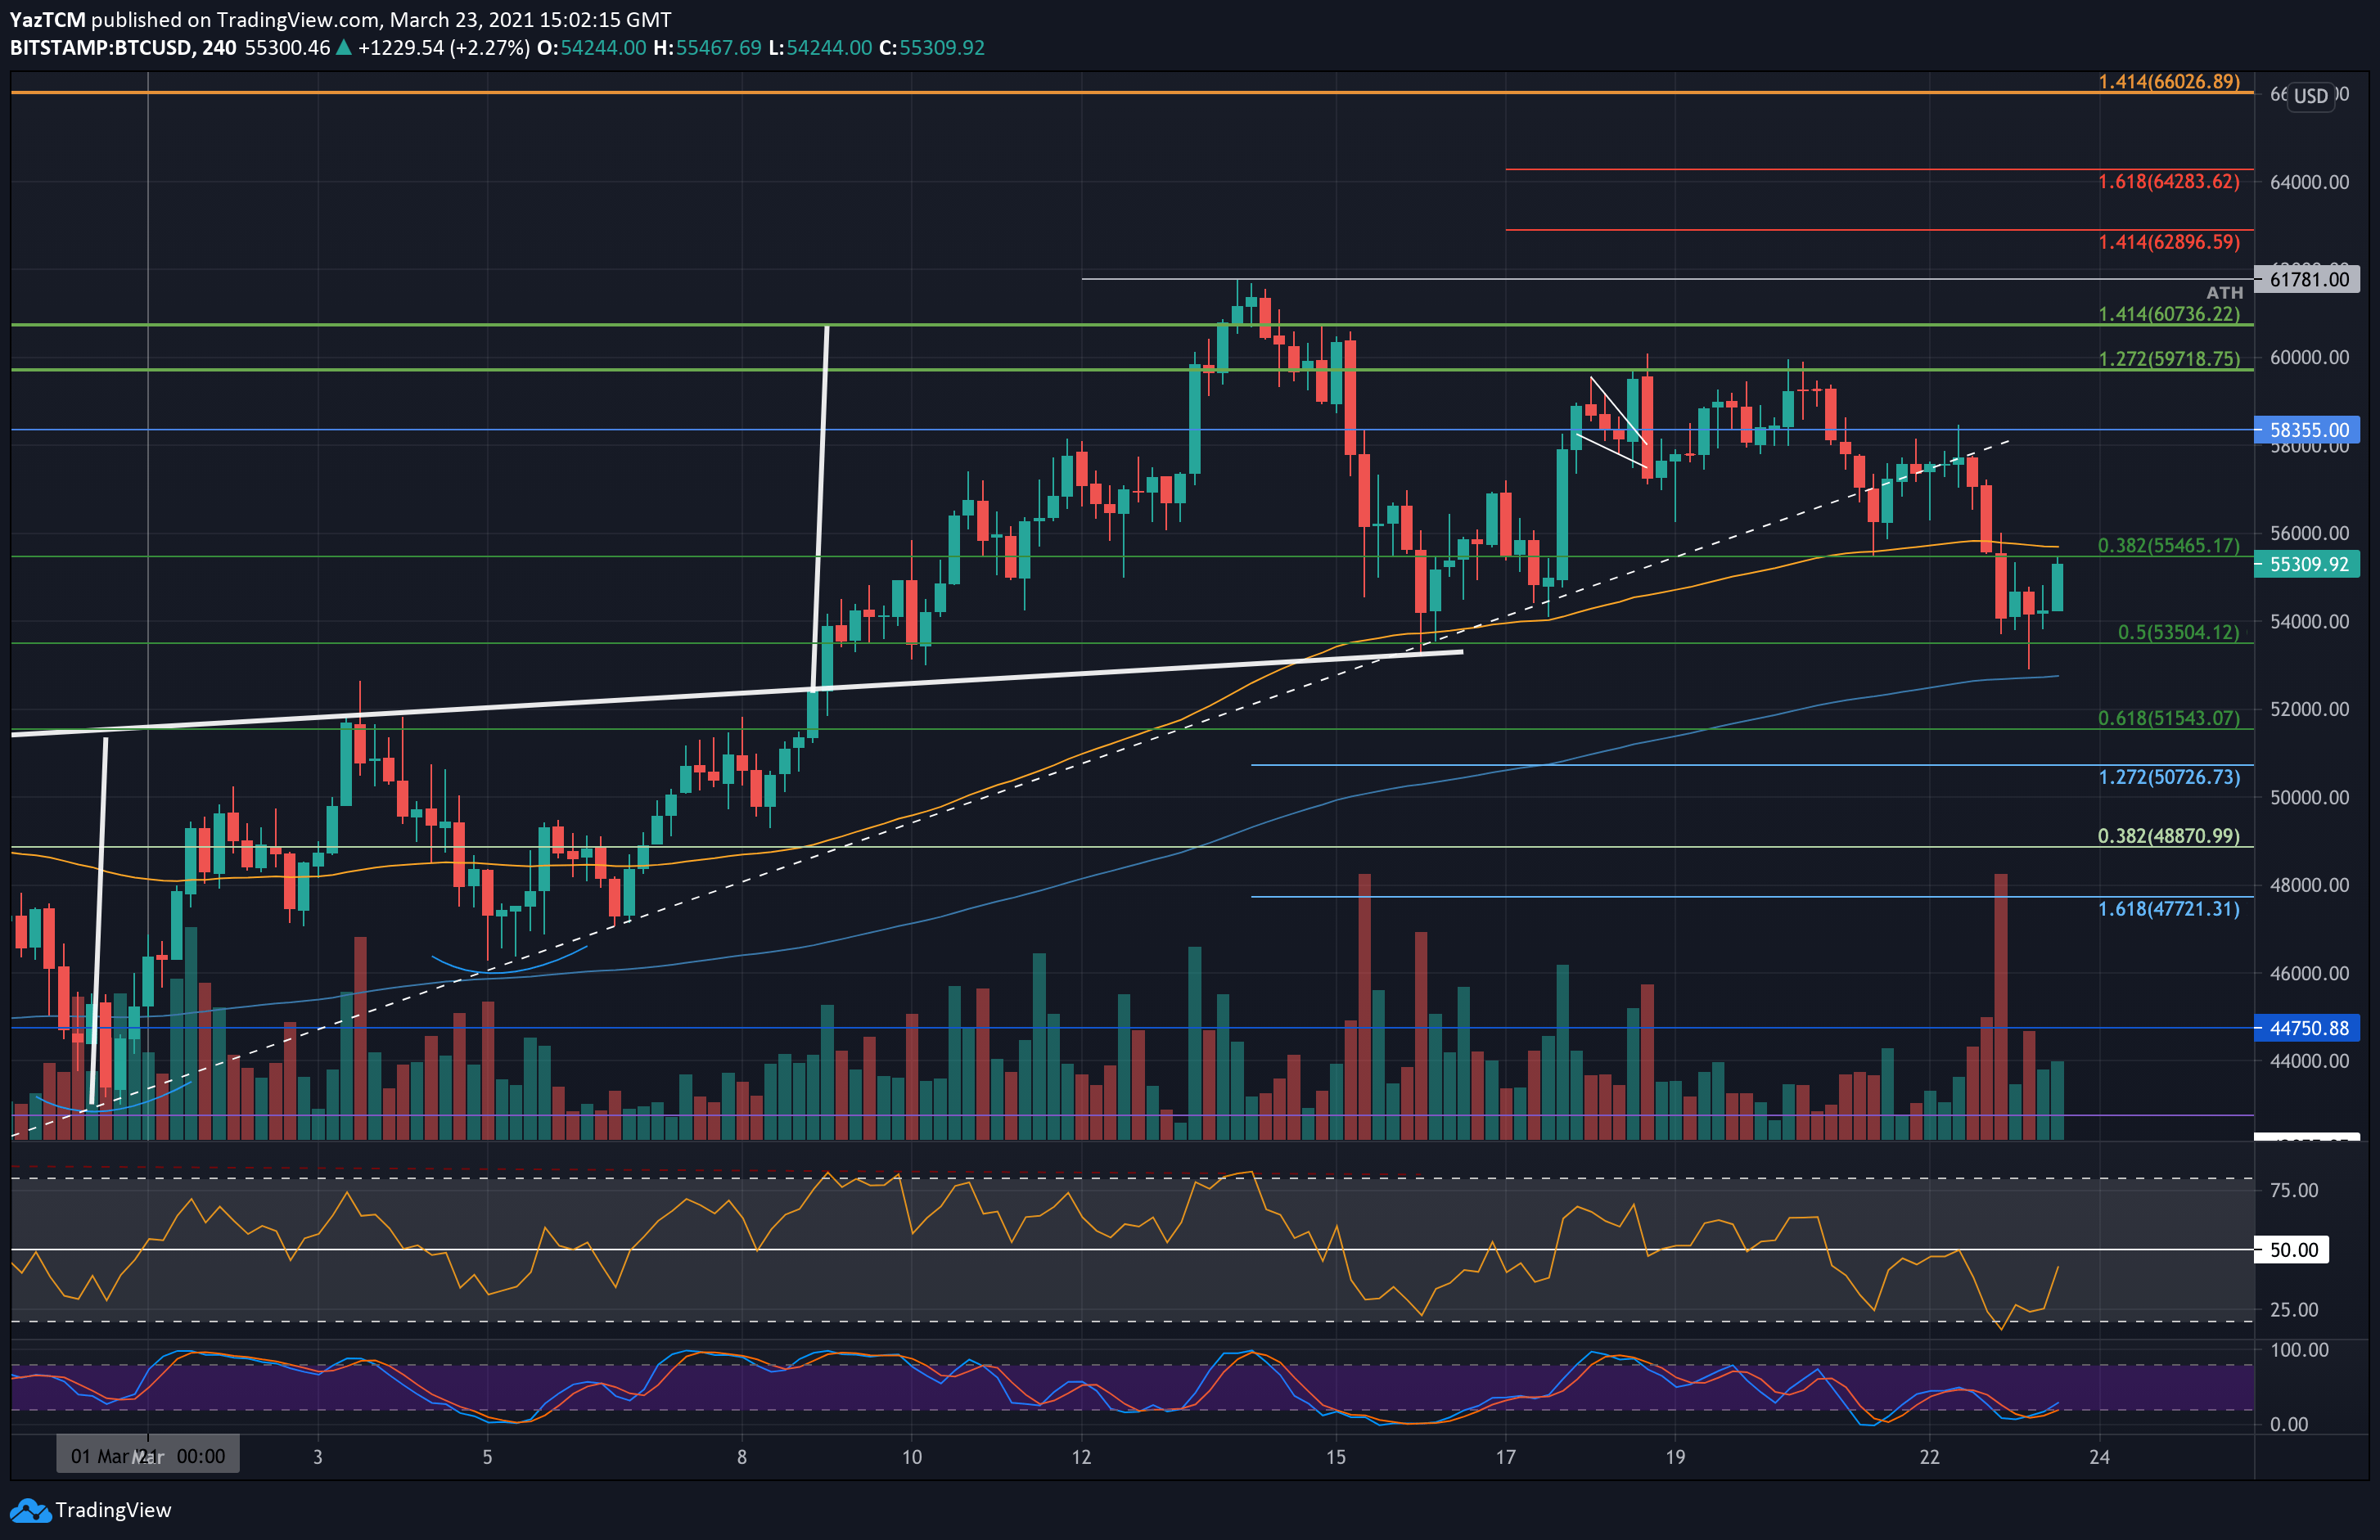
Earlier today, Bitcoin spiked further lower to reach as low as $52,930. Luckily, it found solid short-term support at $54,000, best seen on the 4-Hour charts, and bounced higher from there to climb back above $55,000.
This recent breakdown for BTC might set a short-term bearish trajectory for the coin as it starts to make fresh 2-weeks low.
BTC Price Support and Resistance Levels to Watch
Key Support Levels: $52,000, $52,000, $51,500, $50,700, $50,000.
Key Resistance Levels: $55,000, $58,350, $60,000, $61,780, $62,900.
Looking ahead, the first level of support lies at $54,000. This is followed by support at $52,000, $51,500 (.618 Fib), $50,700 (downside 1.272 Fib Extension), and $50,000.
On the other side, the first resistance lies at $55,500. This is followed by $58,350, $60,000 (1.618 Fib Extension), $61,780 (ATH), and $62,900 (1.414 Fib Extension – red).
The RSI has now plunged beneath the midline, indicating short-term bearish momentum within the market. If it continues to drop, the increased bearish momentum will likely drag Bitcoin back toward $50,000.
Luckily, the Stochastic RSI is already extremely oversold, and a bullish crossover signal should help to stall the downtrend.
Bitstamp BTC/USD Daily Chart
Bitstamp BTC/USD 4-Hour Chart