The Bitcoin (BTC) price was rejected by the $37,700 resistance area on Jan. 19 and dropped immediately after.
Nevertheless, Bitcoin is still holding on above support and is expected to resume its consolidation.
Bitcoin in a Symmetrical Triangle
Bitcoin has continued consolidating inside the symmetrical triangle since Jan. 4.
Yesterday, it was rejected by the 0.618 Fib retracement level of the most recent downward movement at $37,709 and dropped sharply.
However, BTC is still trading above the support line of this triangle.
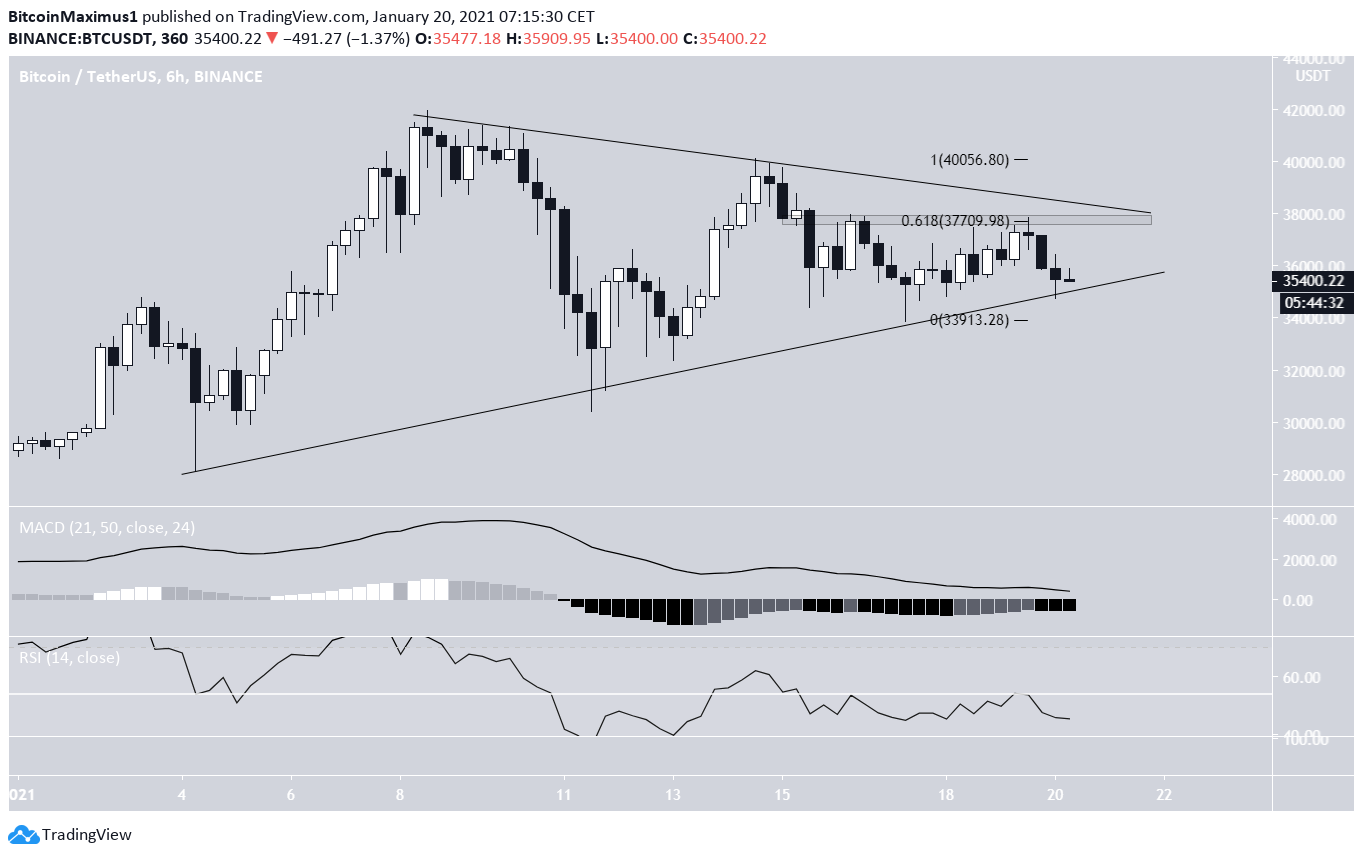
Technical indicators are neutral and fail to confirm the direction of the trend.
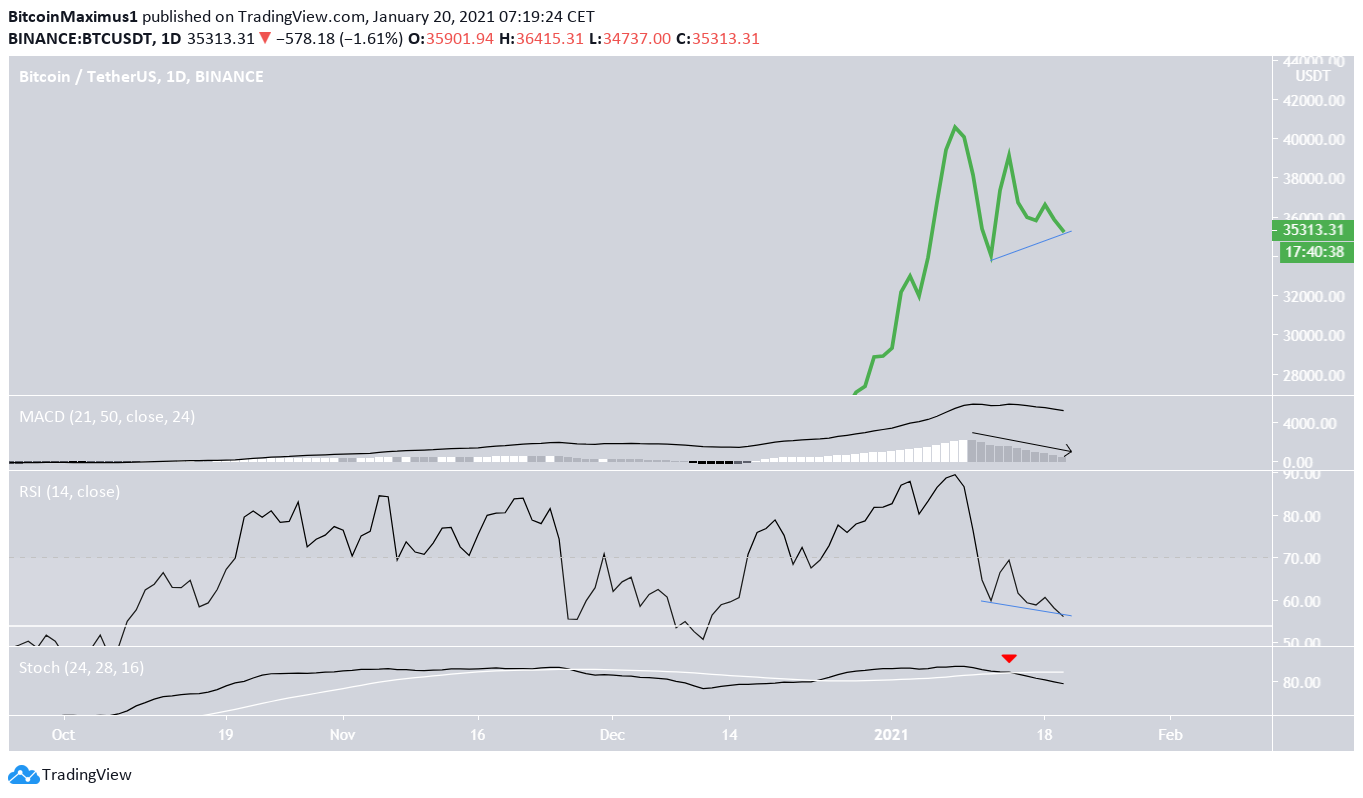
The readings from the daily chart are ambiguous. While the MACD and Stochastic oscillator are bearish, the daily RSI has generated a significant hidden bullish divergence — a strong sign of trend continuation.
Therefore, while an upward move could occur as a result of the hidden bullish divergence, it seems that the longer-term trend is bearish.
BTC Wave Count
In BeInCrypto’s Bitcoin analysis from yesterday, we stated that;
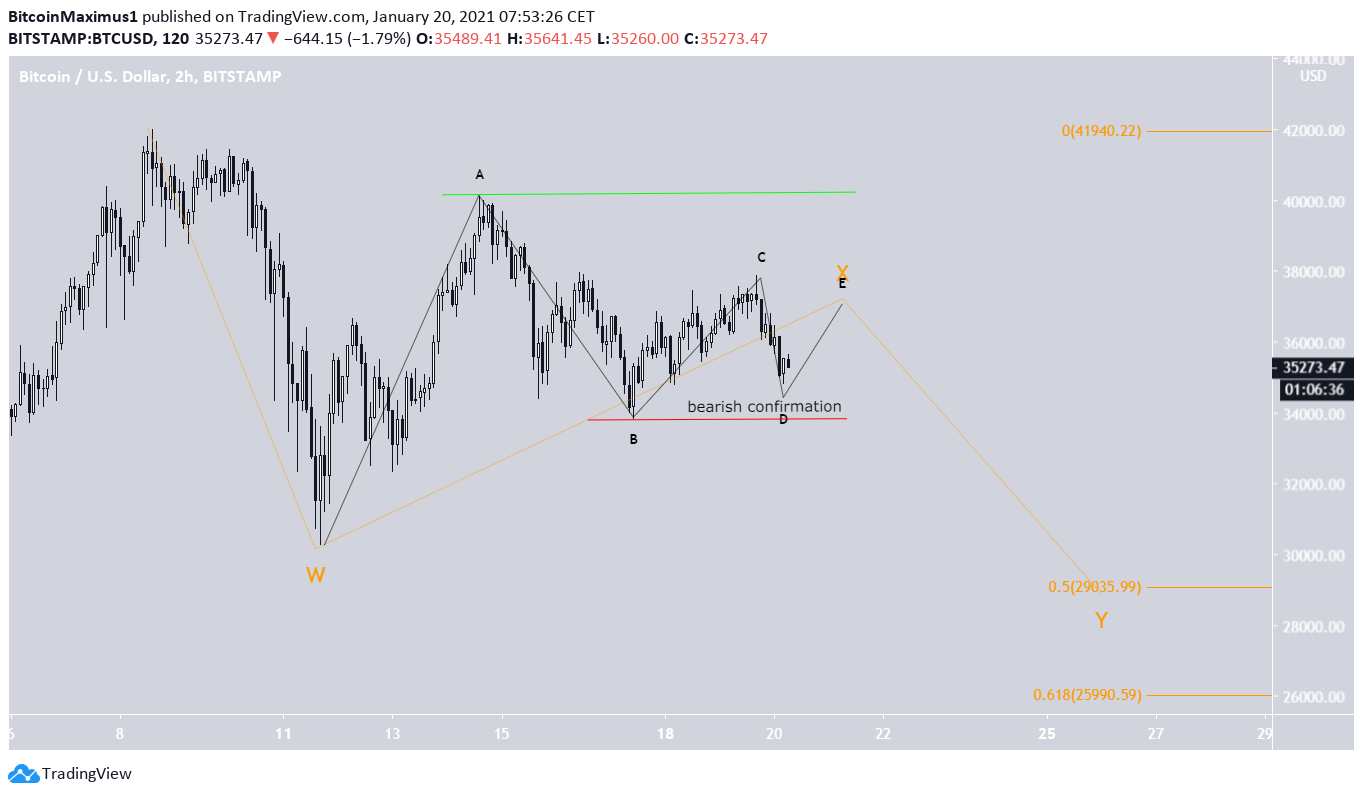
“The wave count suggests that BTC is trading inside a complex W-X-Y correction (shown in orange below), in which the X wave is a triangle. This also fits with the longer-term count, which suggests that BTC is correcting from the upward movement beginning in September 2020.”
BTC possibly completed the C wave of the triangle with its rejection yesterday and is now likely in the D or E wave.
A correction would be expected after the formation is complete. This would be confirmed by a decrease below the B wave low of $33,833 (red line).
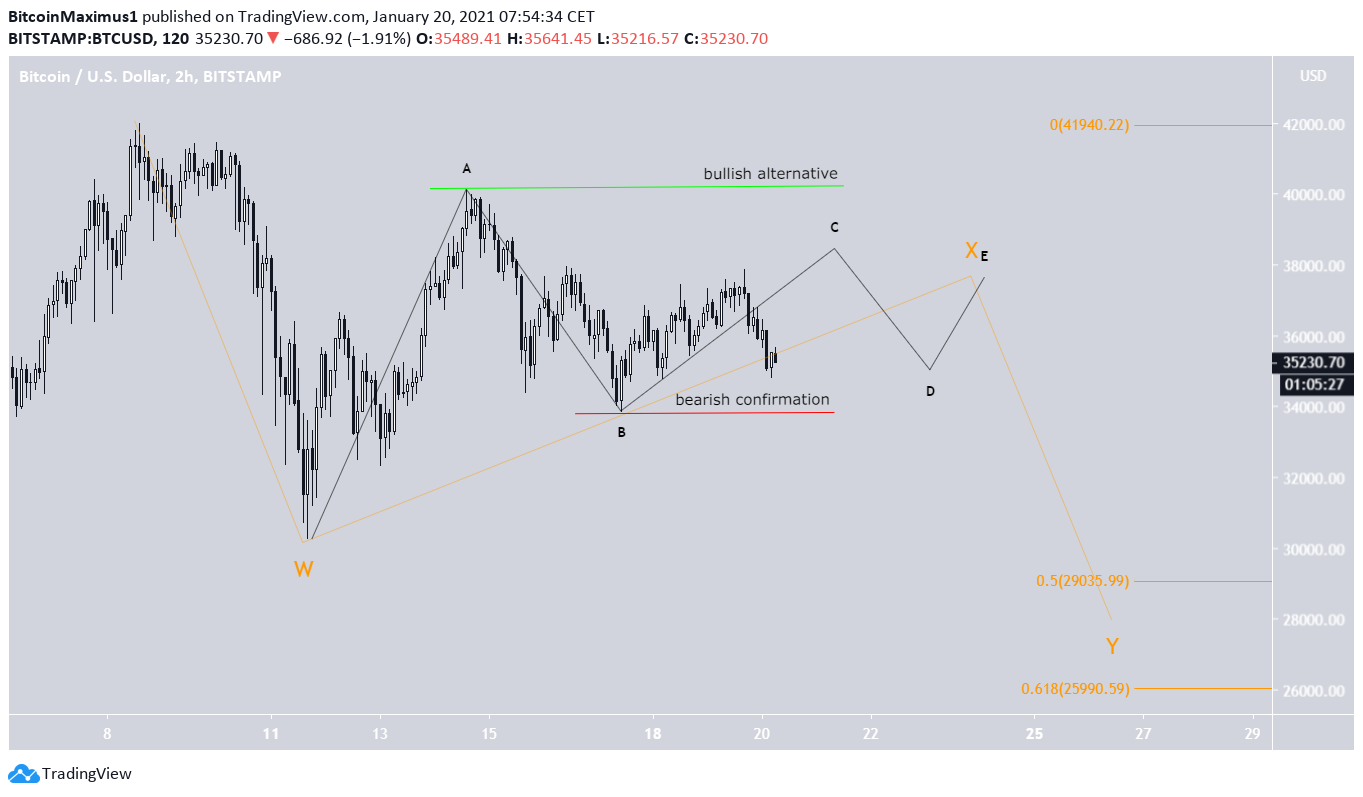
On the other hand, an increase above the A wave high of $40,112 would likely indicate that BTC is still in a bullish trend.
It is possible that BTC is still in the C wave, but that cannot be determined at this point. This scenario wouldn’t have an effect on the longer-term picture or the bullish/bearish invalidation levels.
Conclusion
Bitcoin is expected to continue consolidating inside its symmetrical triangle before breaking down. A decrease below $33,833 would confirm that the correction has begun.