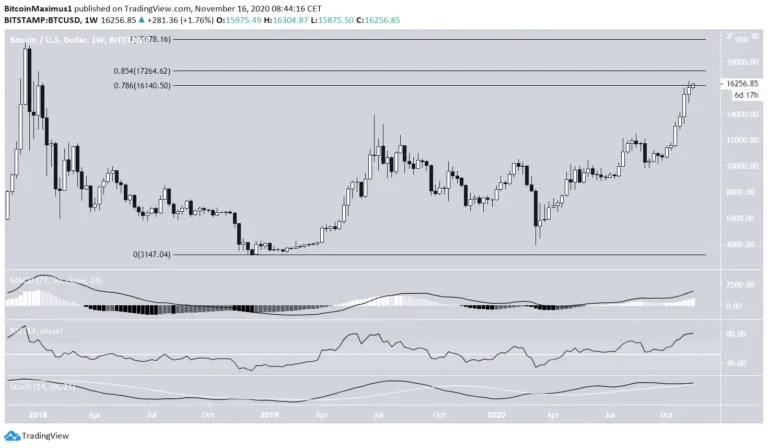
The Bitcoin (BTC) price increased incrementally during the week of Nov 9-16. Even though the price failed to reach a close above $16,000, it returned to validate the previous breakout level and has begun to increase once more.
During the week of Nov 9-16, BTC increased slightly, creating a small bullish candlestick with wicks on each side. The price reached a high of $16,494, but dropped shortly afterward and reached a close below $16,000.
Bitcoin Technical Indicators
Technical indicators do not yet show any weakness and there is no bearish divergence present. The Stochastic Oscillator made yet to make a bearish cross.
Nevertheless, the price is trading inside the important 0.768 Fib resistance level, which is found at $16,140. BTC has not yet reached a close above this level.
The next important resistance area would likely be found at $17,264, the 0.854 Fib retracement level.
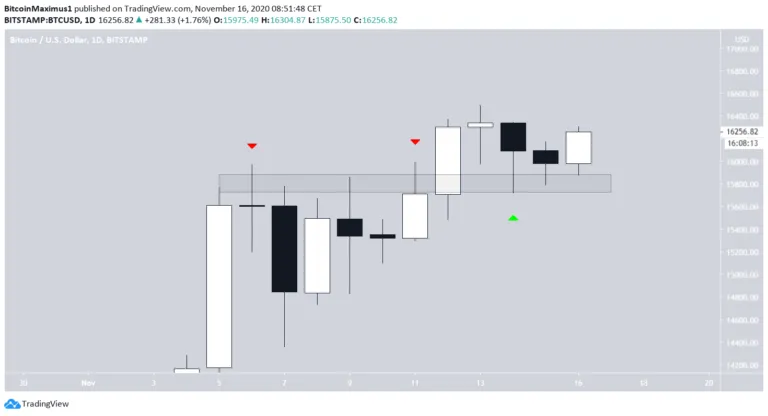
BTC Re-Tests Support Level
The daily time-frame shows the importance of the $15,800 area, which acted as resistance until the Nov 12 breakout.
Since then, the area has turned to support and caused a long lower wick to be formed on Nov 14, a sign of buying pressure.
As long as the price is trading above this level, the possibility of continuation remains high.
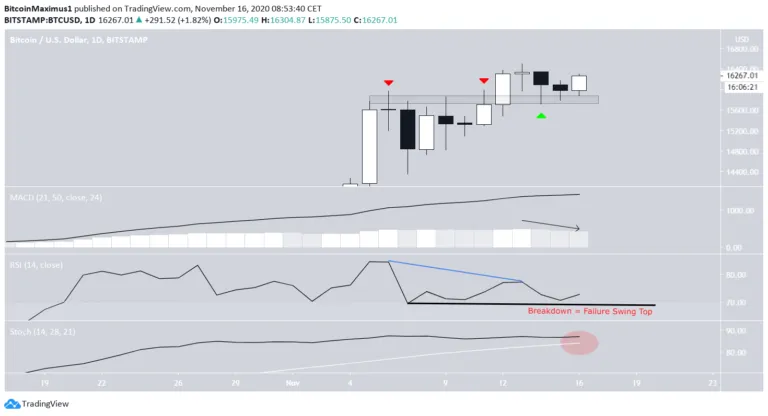
In the daily time-frame, technical indicators have not yet shown decisive weakness, but are relatively close to doing so:
- The MACD has begun to lose its momentum but has not yet begun to decrease.
- The Stochastic Oscillator has not made a bearish cross but is not increasing either.
- The RSI has generated some bearish divergence but has not completed a swing failure top.
The RSI occurrence is especially important since a decrease below 70 would both complete the failure swing top and cause a cross from overbought territory back below 70 — a bearish signal.
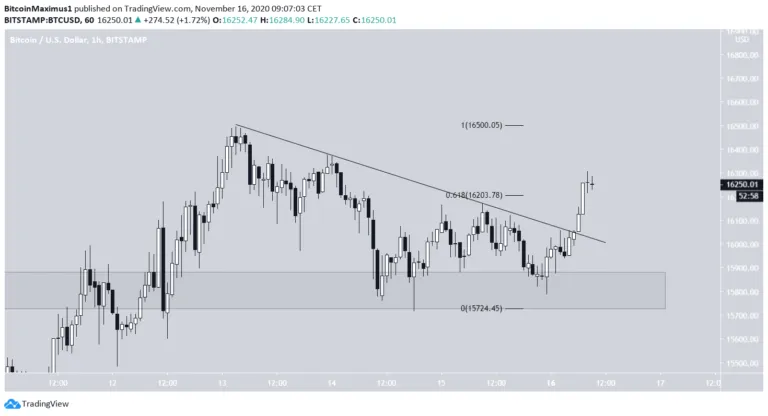
Short-Term Movement
In the shorter-term one-hour chart, the price has broken out from a descending resistance line that had been in place since the Nov 13 highs.
Afterward, BTC swiftly moved above the 0.618 Fib resistance level, a strong sign that makes the increase more likely to be the beginning of a new upward move than it is to be corrective.
While a short-term decrease could occur, possibly to validate the descending resistance line, it seems likely that Bitcoin will resume its upward movement.
Conclusion
As long as BTC is trading above the $15,800 area, which has now turned to support, the possibility of continuation remains high.
Disclaimer: Cryptocurrency trading carries a high level of risk and may not be suitable for all investors. The views expressed in this article do not reflect those of BeInCrypto