Bitcoin price nearly set a new higher high and confirmed a bull trend. But before the leading cryptocurrency by market cap could set a new peak, a popular trading indicator might have jumped the gun and confirmed the bull market.
The rare reading on the Relative Strength Index has only happened a grand total of 14 times in more than a decade, and on average each impulse has resulted in over 239% upside. This signal has only just appeared, potentially, suggesting that the latest impulse could reach as high as $31,000 per BTC. Here’s what could possibly happen next in crypto.
BTCUSD Weekly Relative Strength Index Reach Bull Market Levels
Browsing anywhere in the media or in social communities, and you’ll find talk about Bitcoin and how it could finally be turning a corner with investors.
Businesses, institutions, and hedge fund managers are suddenly pouring money in, rather than past bull cycles being driven by retail investors. Over 3% of the total BTC supply of 21 million BTC is now held by 24 companies alone.
Related Reading | Crypto Analyst Warns That A Bitcoin “Hell Candle” Is Coming
The asset’s block reward halving, expected to be the catalyst to start the new cycle, is now in the past. The only thing missing is a higher high to confirm an uptrend and new bull market.
Bitcoin missed the mark by just a few bucks last night and has since sunk nearly $1,000, briefly crashing below $13,000 less than 24 hours later.

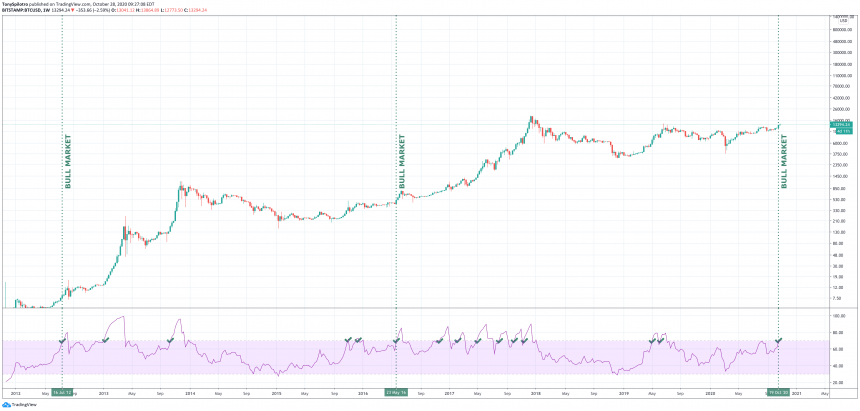
Two failed early BTC bull market readings, led to the third being the charm | Source: BTCUSD on TradingView.com
But it could be too late for bears that initiated last night’s selloff? On the weekly BTCUSD Relative Strength Index indicator, the top cryptocurrency might have already confirmed a new bull market or at least a bullish impulse just starting that should send the cryptocurrency soaring higher.
RSI Breakout Results In Bitcoin Rally Of 239% On Average, Only 14 Times In History
The leading cryptocurrency by market cap could be about to pull off an amazing feat, and rise anywhere from 36% on the lowest end to as much as 1913% once breaking above 70 on the weekly Relative Strength Index.
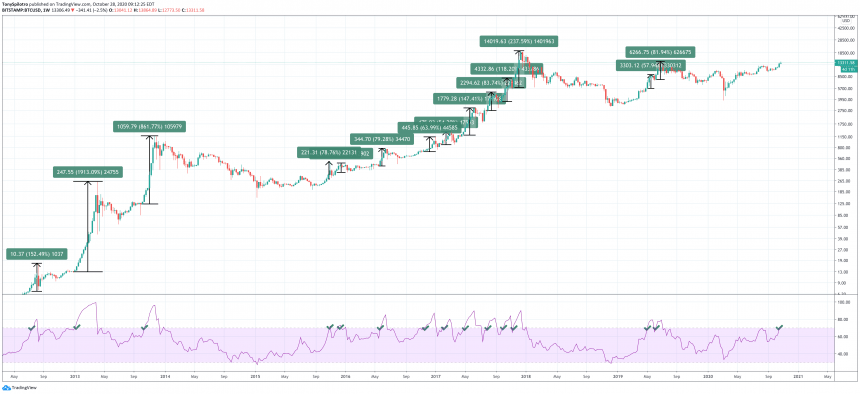
Fourteen RSI breakouts resulted in 239% climb on average | Source: BTCUSD on TradingView.com
On average, across only 14 times that this bullish signal happened, Bitcoin continued to climb another 239%. Another 239% from current levels, would put the BTC at a price of roughly $31,00 and set a new all-time high.
Related Reading | Bitcoin Whale Wallets With 1000+ BTC Or More Spike To Highest Levels In History
Past results don’t guarantee future performance, and anything is possible. But if the weekly can close above this key bullish level, a new bull run could be here, and an explosive move will soon confirm it.
Featured image from Deposit Photos, Charts from TradingView.com