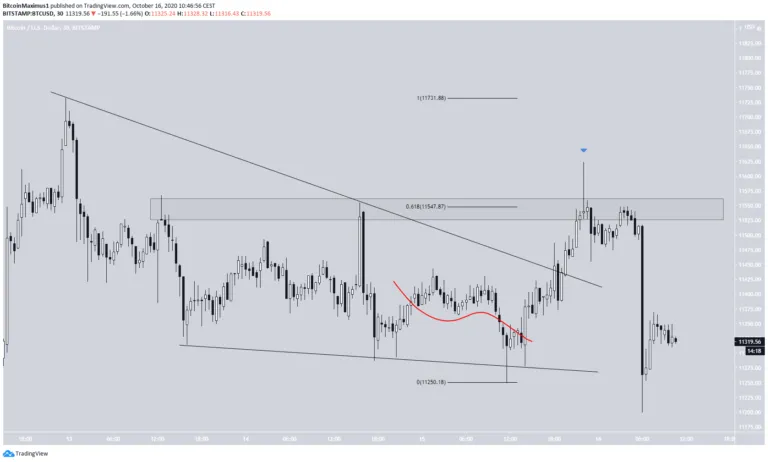
On Oct. 15, the Bitcoin (BTC) price broke out from its short-term descending wedge, but failed to sustain its higher prices. An upward move towards the targets given below is still the most likely scenario.
Breakout From Wedge
Since reaching a high on Oct. 12, the BTC price has been trading inside a descending wedge, which is considered a bullish reversal pattern. The price broke out from the wedge on Oct. 15, reaching a high of $11,623, slightly above the 0.618 Fib level of the previous decrease and above the $11,550 minor resistance area.
However, the higher prices could not be sustained and BTC left a long upper wick in its wake, decreasing afterwards. The $11,550 area is now expected to act as resistance.
BTC Resting At Support
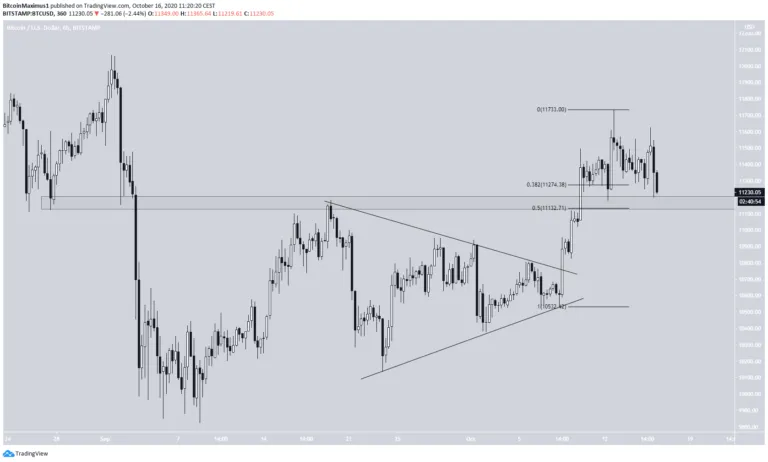
The BTC price has been increasing since breaking out from a symmetrical triangle on Oct. 9, reaching a high of $11,731 on Oct. 12.
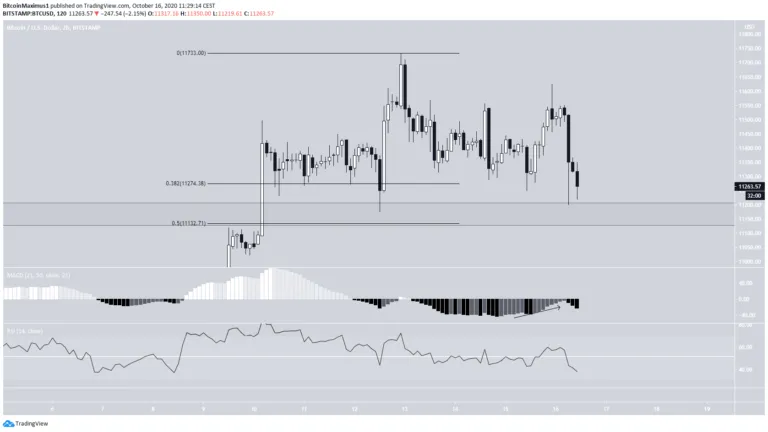
Currently, the price has returned to validate the $11,150 area as support. The area previously acted as resistance, and is near the 0.5 Fib level of the entire upward move resulting from the triangle breakout.
Despite the re-test, there are no clear reversal signs. While the MACD initially began to move upwards, it failed to cross into positive territory and has been decreasing since.
The RSI is also decreasing and has fallen below 50. Therefore, while the price action is akin to bullish continuation, technical indicators do not yet give any bullish reversal signs.
Wave Count
In yesterday’s analysis, it was stated that:
“If the count is correct, the price could increase towards $11,918 and $12,231 in order to complete wave 5.”
The price seems to be in wave 4, which is expected to end near this $11,150 area, before wave 5 begins (shown in red below). Wave 5 would be expected to end near $11,920.
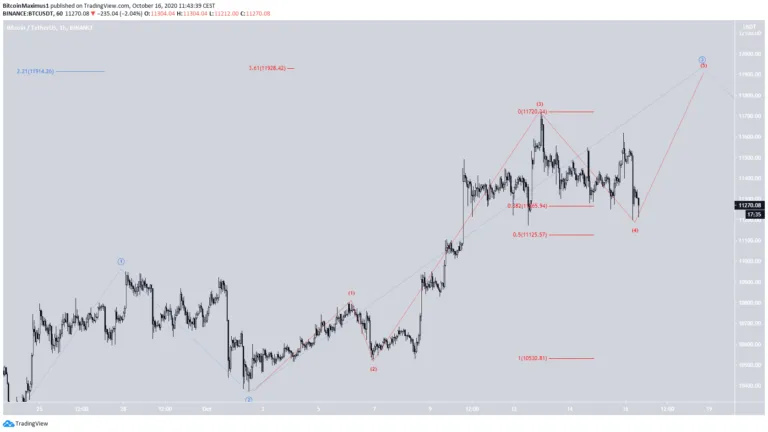
However, failure to incorporate the short-term count into the longer-term one allows for the possibility that the price is correcting instead. While this would not change the short-term count, in which an increase to $11,900 would still be expected, the longer-term count would be different, since a significant decrease would be expected afterwards.
The reaction once the price gets to $11,900 will help in determining which is the correct count.
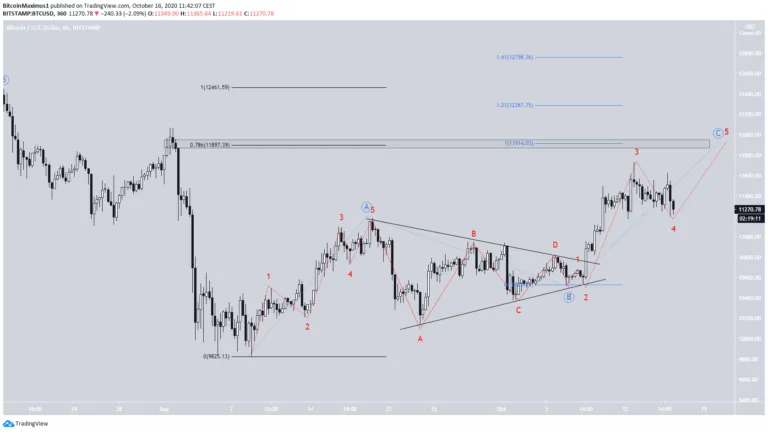
To conclude, while an upward move towards $11,900 is expected, it is not clear whether the price will continue increasing above the area or get rejected.
Disclaimer: Cryptocurrency trading carries a high level of risk and may not be suitable for all investors. The views expressed in this article do not reflect those of BeInCrypto.