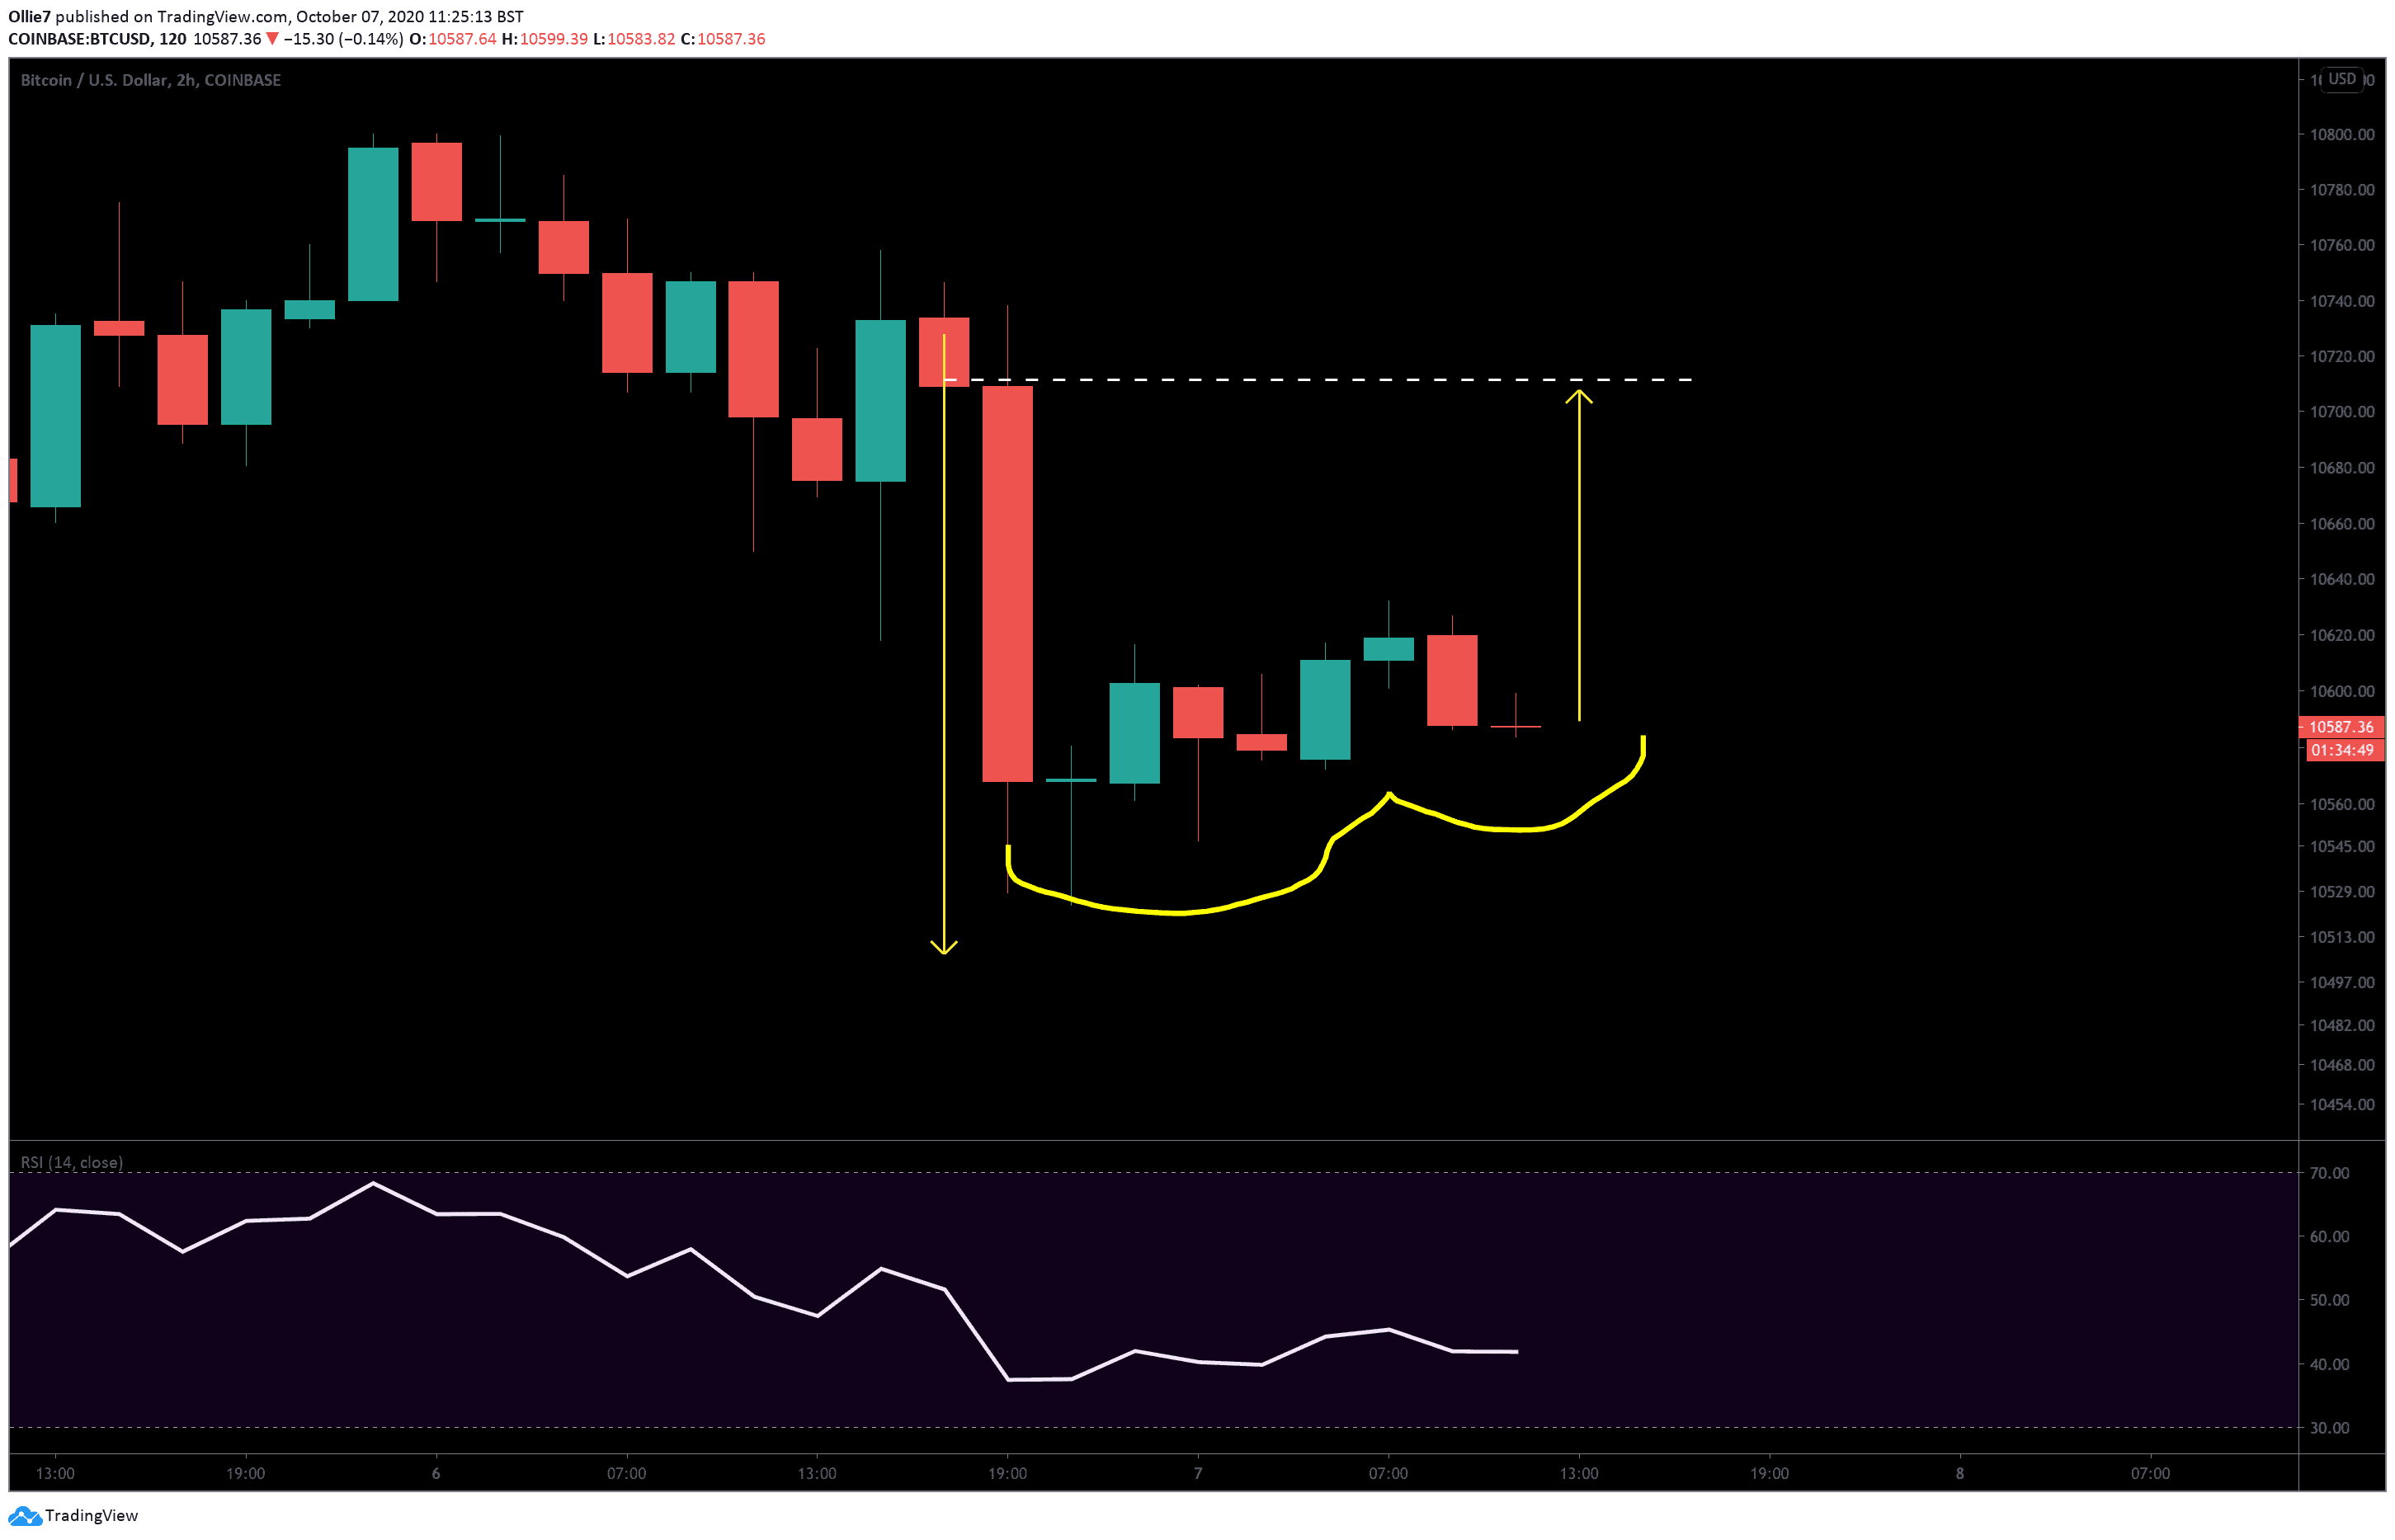
Bitcoin price appears to be tracking in another classic whale manipulation pattern right now, after yesterday’s sharp $200 crash during the US trading session.
The details of this pattern have already been covered extensively in a previous analysis, but for those of you not familiar, it essentially represents a strategy employed by large BTC traders (whales) to create panic in the market and force weaker hands to sell. The induced rise in selling pressure creates more liquidity on the sell-side and allows large traders to buy back into Bitcoin at a cheaper price with less price slippage.
If this current movement does turn out to be one of these patterns, we should expect to see BTC prices return back above $10,740 quickly (see the first chart).
Price Levels to Watch in the Short-term
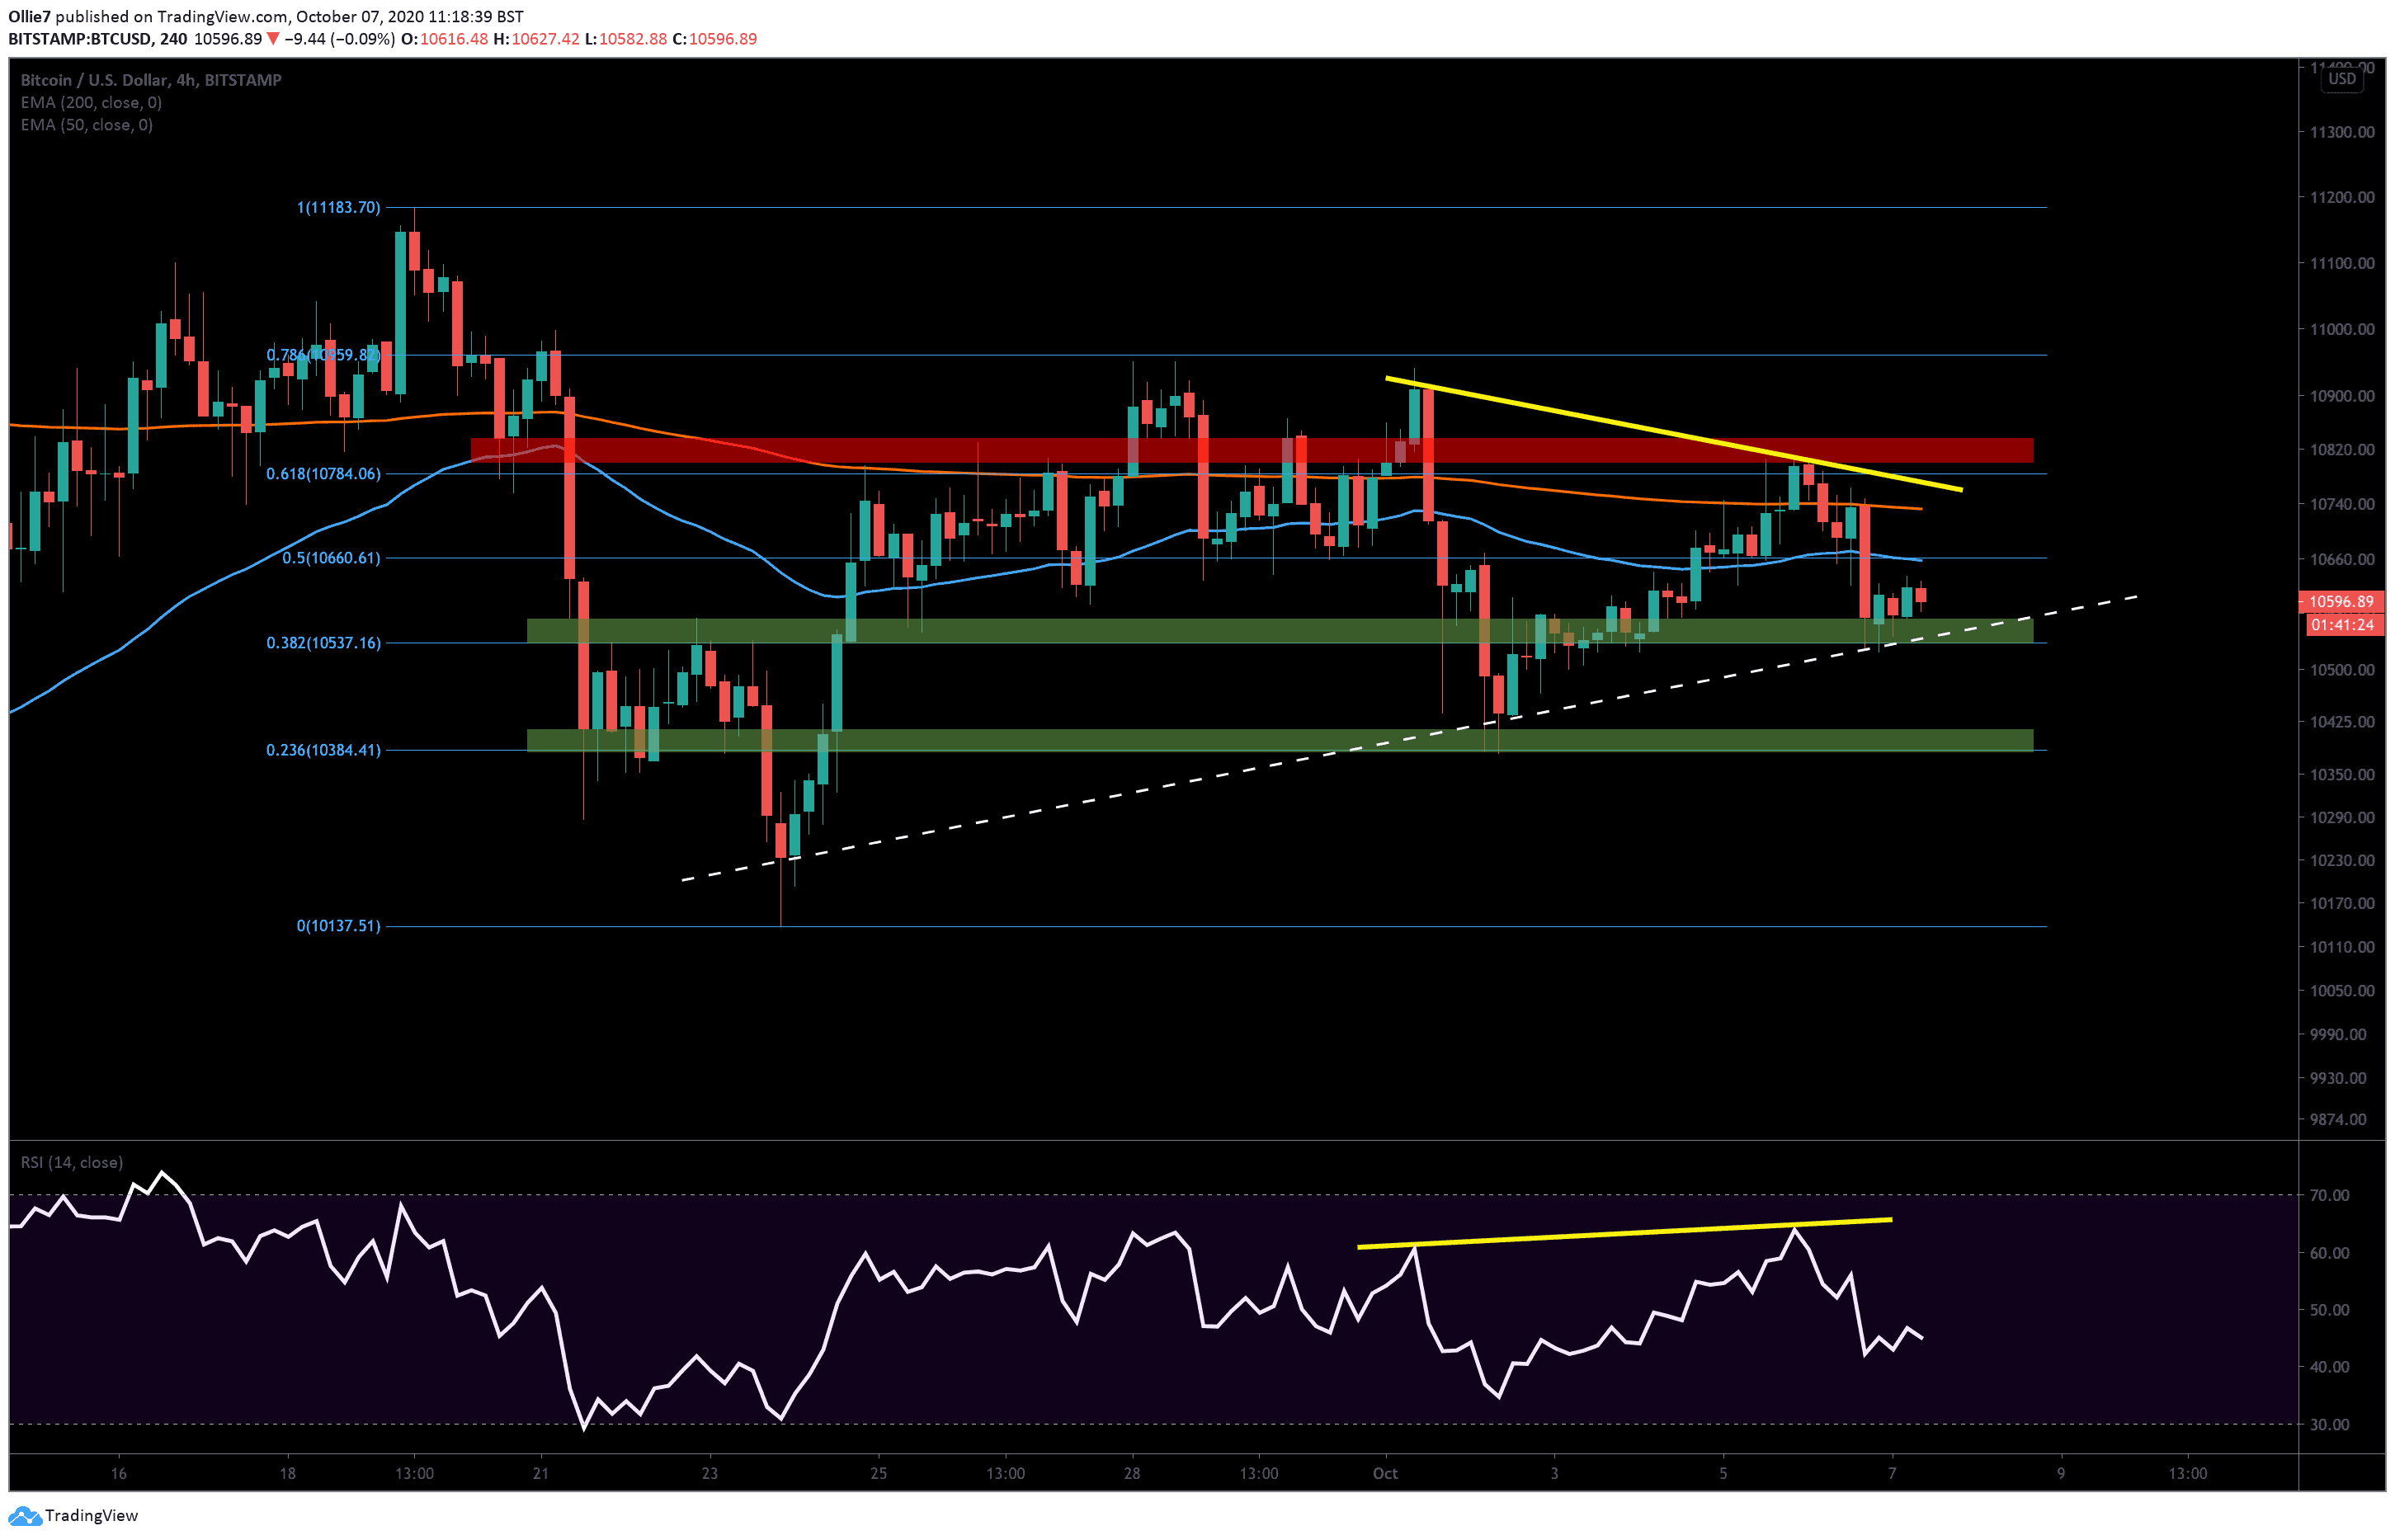
On the 4-hour BTC/USD chart, we can see that the sudden crash appears to have been caused by a clear rejection at the 200 EMA line (red).
Following the decline, prices fell back on to a major support zone (top green bar) that sits on top of the 0.382 Fibonacci level at $10,537. This area is also reinforced by an up-trending support level that connects the higher lows (white dashed line).
The 50 EMA (blue) and the 0.5 Fibonacci level at $10,660 will now act as the first major resistance to break, followed quickly by the 200 EMA that currently sits around the $10,730 level.
If the first support zone breaks, then the second area down at $10,400 will be the next most likely level where bullish traders will have an opportunity to push back from.
With Bitcoin consolidating between lower highs and higher lows, a break beneath the dashed white line will almost certainly indicate plenty more downside to come.
There is some hope, however, that bullish momentum is strengthening. On the RSI, we can see a present, albeit faint, bullish divergence between the price action and the indicator line (yellow lines). Over the last 7 days, Bitcoin printed a higher high followed by a lower high. On the RSI, however, the indicator line did the opposite. This suggests that the current trend is turning increasingly bullish and could be foreshadowing an imminent rally.
Total market capital: $337 billion
Bitcoin market capital: $195 billion
Bitcoin dominance: 58.0%
*Data by Coingecko
Bitstamp BTC/USD Whale Pattern
Bitstamp BTC/USD 4-Hour Chart