Bitcoin (BTC) is consolidating inside a neutral pattern and is expected to break out to reach $11,200.
Whether BTC breaks through or gets rejected from this level will likely determine the direction of the longer-term trend.
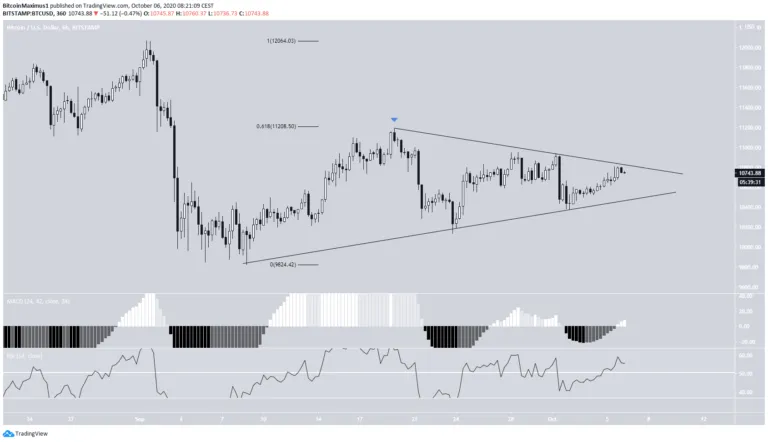
BTC Continues to Consolidate
Bitcoin looks to be trading inside a symmetrical triangle since a local high of $11,983 was reached on Sept 19, coinciding with the 0.618 Fib level of the downward move that preceded it. At the time of press, BTC was trading very close to the resistance line of the triangle.
Technical indicators are bullish. Both the RSI and MACD are increasing — the former has crossed above 50 while the latter has moved into positive territory.
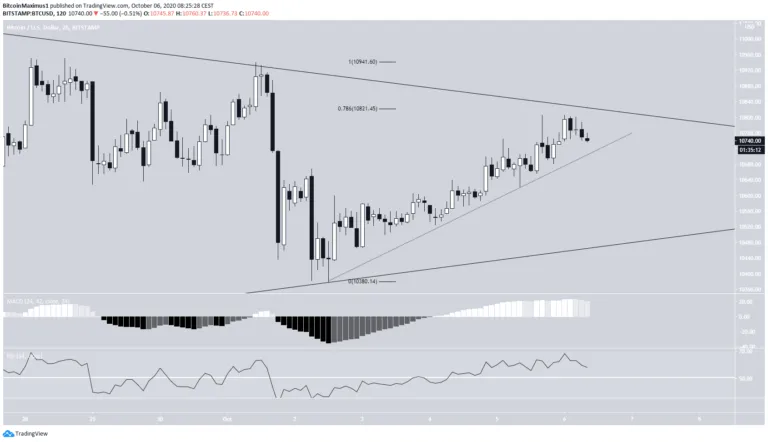
A closer look also shows that the price is following an ascending support line (dashed). Furthermore, it has reached the 0.786 Fib level of the previous short-term decrease, which means that this could be the beginning of a new upward movement rather than a corrective increase.
While there is some weakness developing in the MACD, the price would be expected to break out as long as it is trading above this ascending support line.
A breakout could take the price to the previously mentioned 0.618 Fib level of the entire decrease near $11,200.
Main Resistance
The daily chart shows that the main resistance area is found at $11,200, coinciding with the previous support, 0.618 Fib level, and a descending resistance line.
While it looks as if the price is heading there, a breakout or rejection from the area is likely to determine the direction of the future trend.
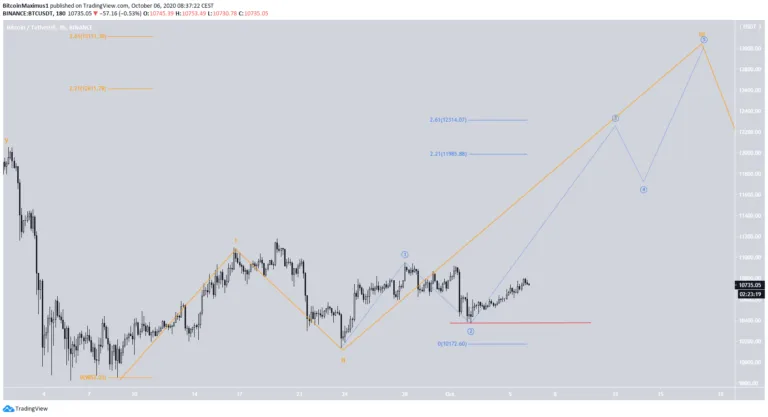
Wave Count
BTC likely began a bullish impulse on Sept 9 (shown in orange below), and now looks to currently be in wave 3.
Inside this wave, the price has completed sub-waves 1-2 (blue) and began the third. This sub-wave has a preliminary target between $11,985-$12,314. A decrease below the $10,380 low (red line) would invalidate this particular wave count.
Disclaimer: Cryptocurrency trading carries a high level of risk and may not be suitable for all investors. The views expressed in this article do not reflect those of BeInCrypto.