$7 billion has exited from the global crypto market in the last 12 hours, leaving a vast majority of token projects, including Bitcoin, in the red today.
Right now, the total market capital stands at around $330 billion, according to Coingecko data. During the early Asian trading session this morning, there was an exodus of $5 billion in less than an hour, but it’s still uncertain why this drop has occurred.
Is this an early sign that bitcoin sentiment is turning bearish?
Bitcoin Technicals
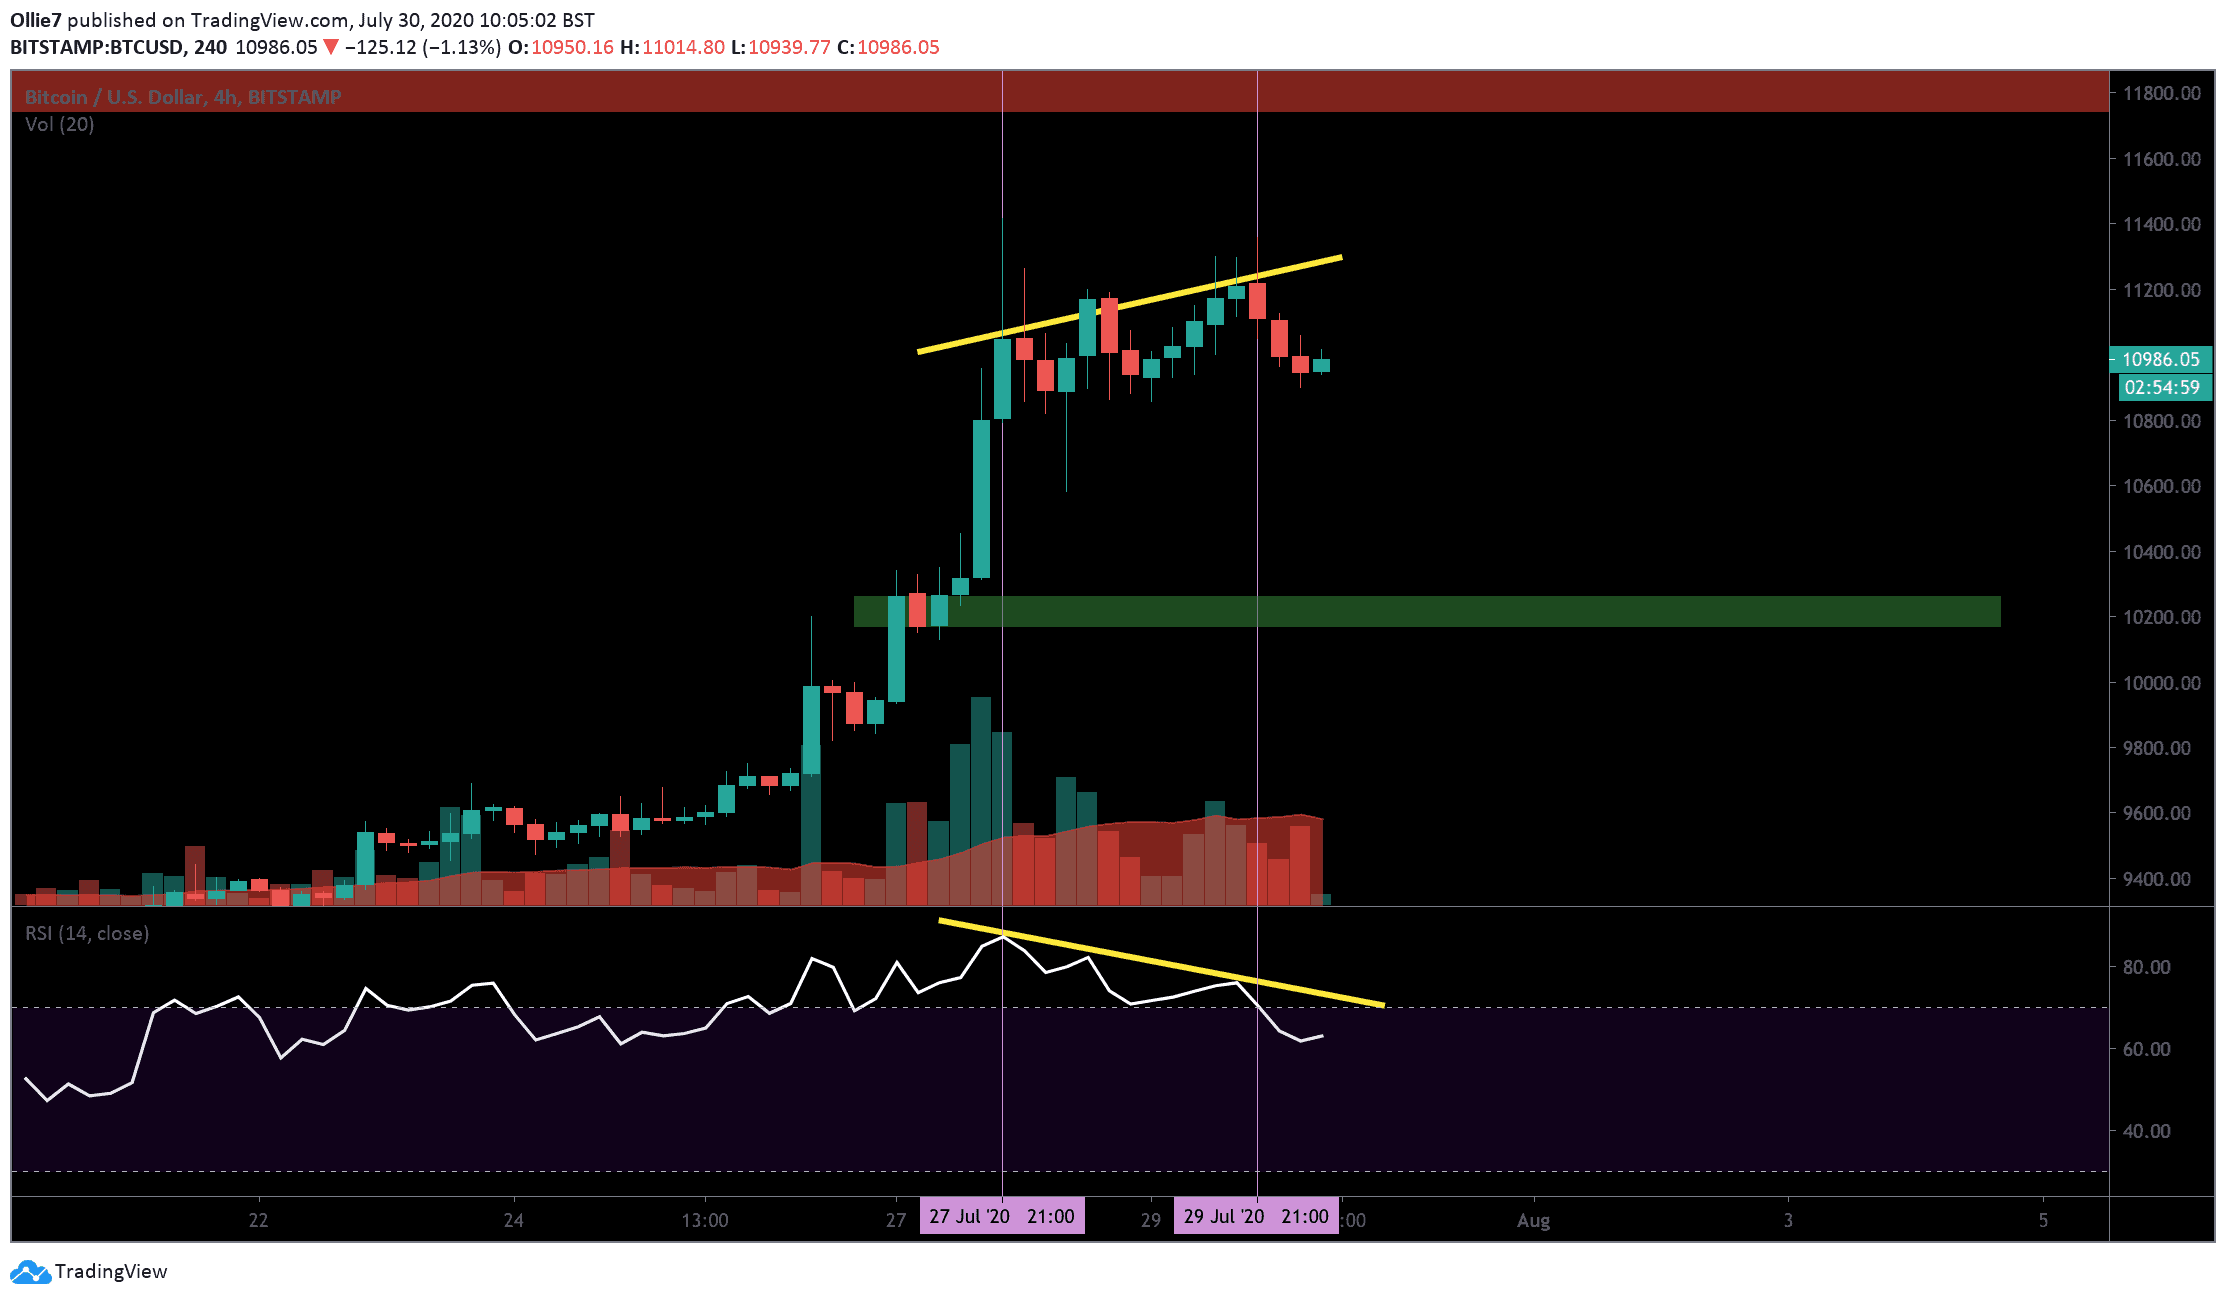
Starting on the smaller time frame, we can see that there is an apparent divergence between the price action and the RSI on the 4-Hour chart.
Between July 27 and July 29, Bitcoin’s price set 3 consecutive higher highs. On the RSI, however, the indicator line dropped each time. This is a typical indication of a weakening trend and may be foreshadowing a bearish reversal in the short-term.
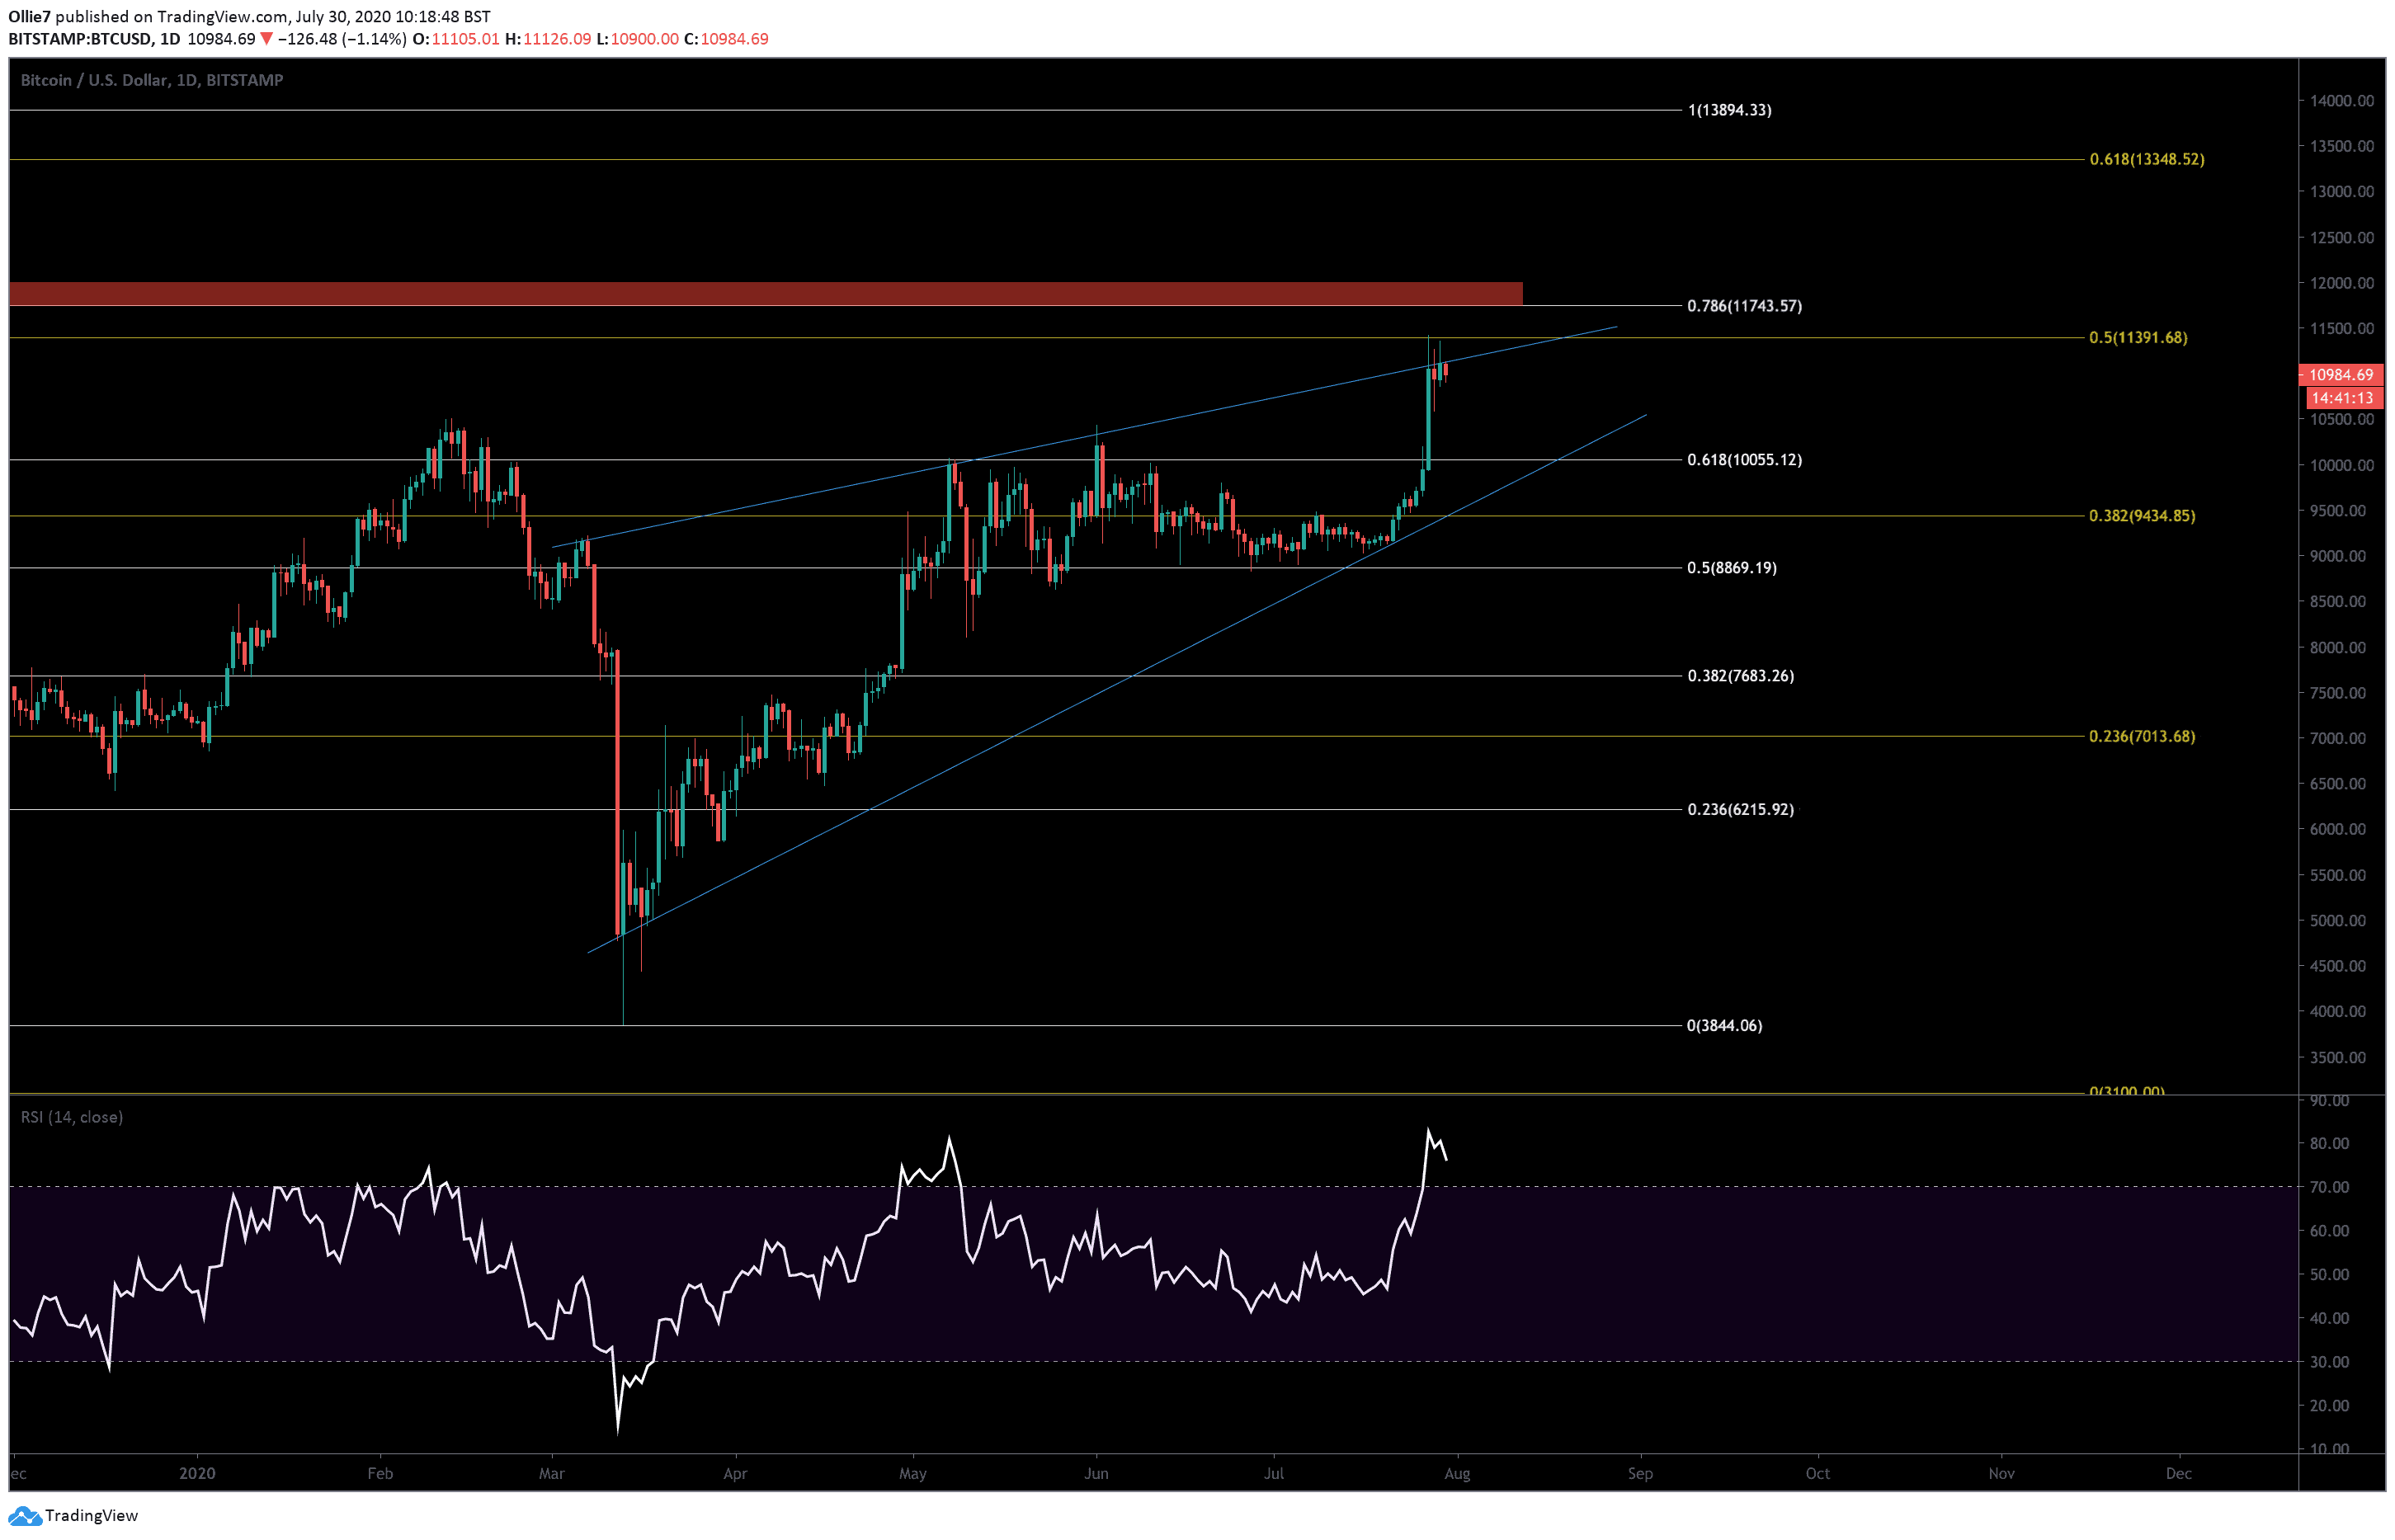
On the daily BTC/USD chart, we can see long wicks above the last three candles as bears battle to keep the price down beneath the 0.5 Fibonacci level at $11,391. This selling pressure is clearly weighing heavy on the current uptrend and could force bulls to retreat unless buying volume increases.
We can also see that the price is currently consolidating against a long-standing resistance line (blue). When connecting the lower lows over the same period (approx since March 20, 2020), we get a sizeable rising wedge pattern. This is typically a bearish pattern, but it could be rejected if Bitcoin’s price closes over the aforementioned 0.5 Fibonacci level.
Price Levels to Watch in the Short-term
On the 4-Hour chart, the first intraday resistance to overcome is the yellow line connecting the higher highs. This is approximately around the $11,290 mark.
From there, the obvious next hurdle will be that all-important 0.5 Fibonacci level at $11,390.
If bears take control of the asset, then we have a potential order block support area around the $10,165 and $10,262 level. If that is broken, we have the psychological $10,00 level, which should attract some support.
Total Market Capital: $330 billion
Bitcoin Market Capital: $202 billion
Bitcoin Dominance Index: 61.5%
*Data by Coingecko.
BTC/USD Bitstamp Daily Chart
BTC/USD Bitstamp 4-Hour Chart