If you’ve been paying attention to Bitcoin’s chart against the US Dollar lately, you will have probably noticed how low BTC/USD trading volatility has been over the last three months. In fact, the leading cryptocurrency has been trading in a tight range of 3±% since June 2.
This, coupled with the fact that the Bollinger bandwidth has constricted to its lowest value since November 2018, has caused a lot of people to panic that a serious crash is coming Bitcoin’s way soon.
Bitcoin Price Levels to Watch in the Short-term
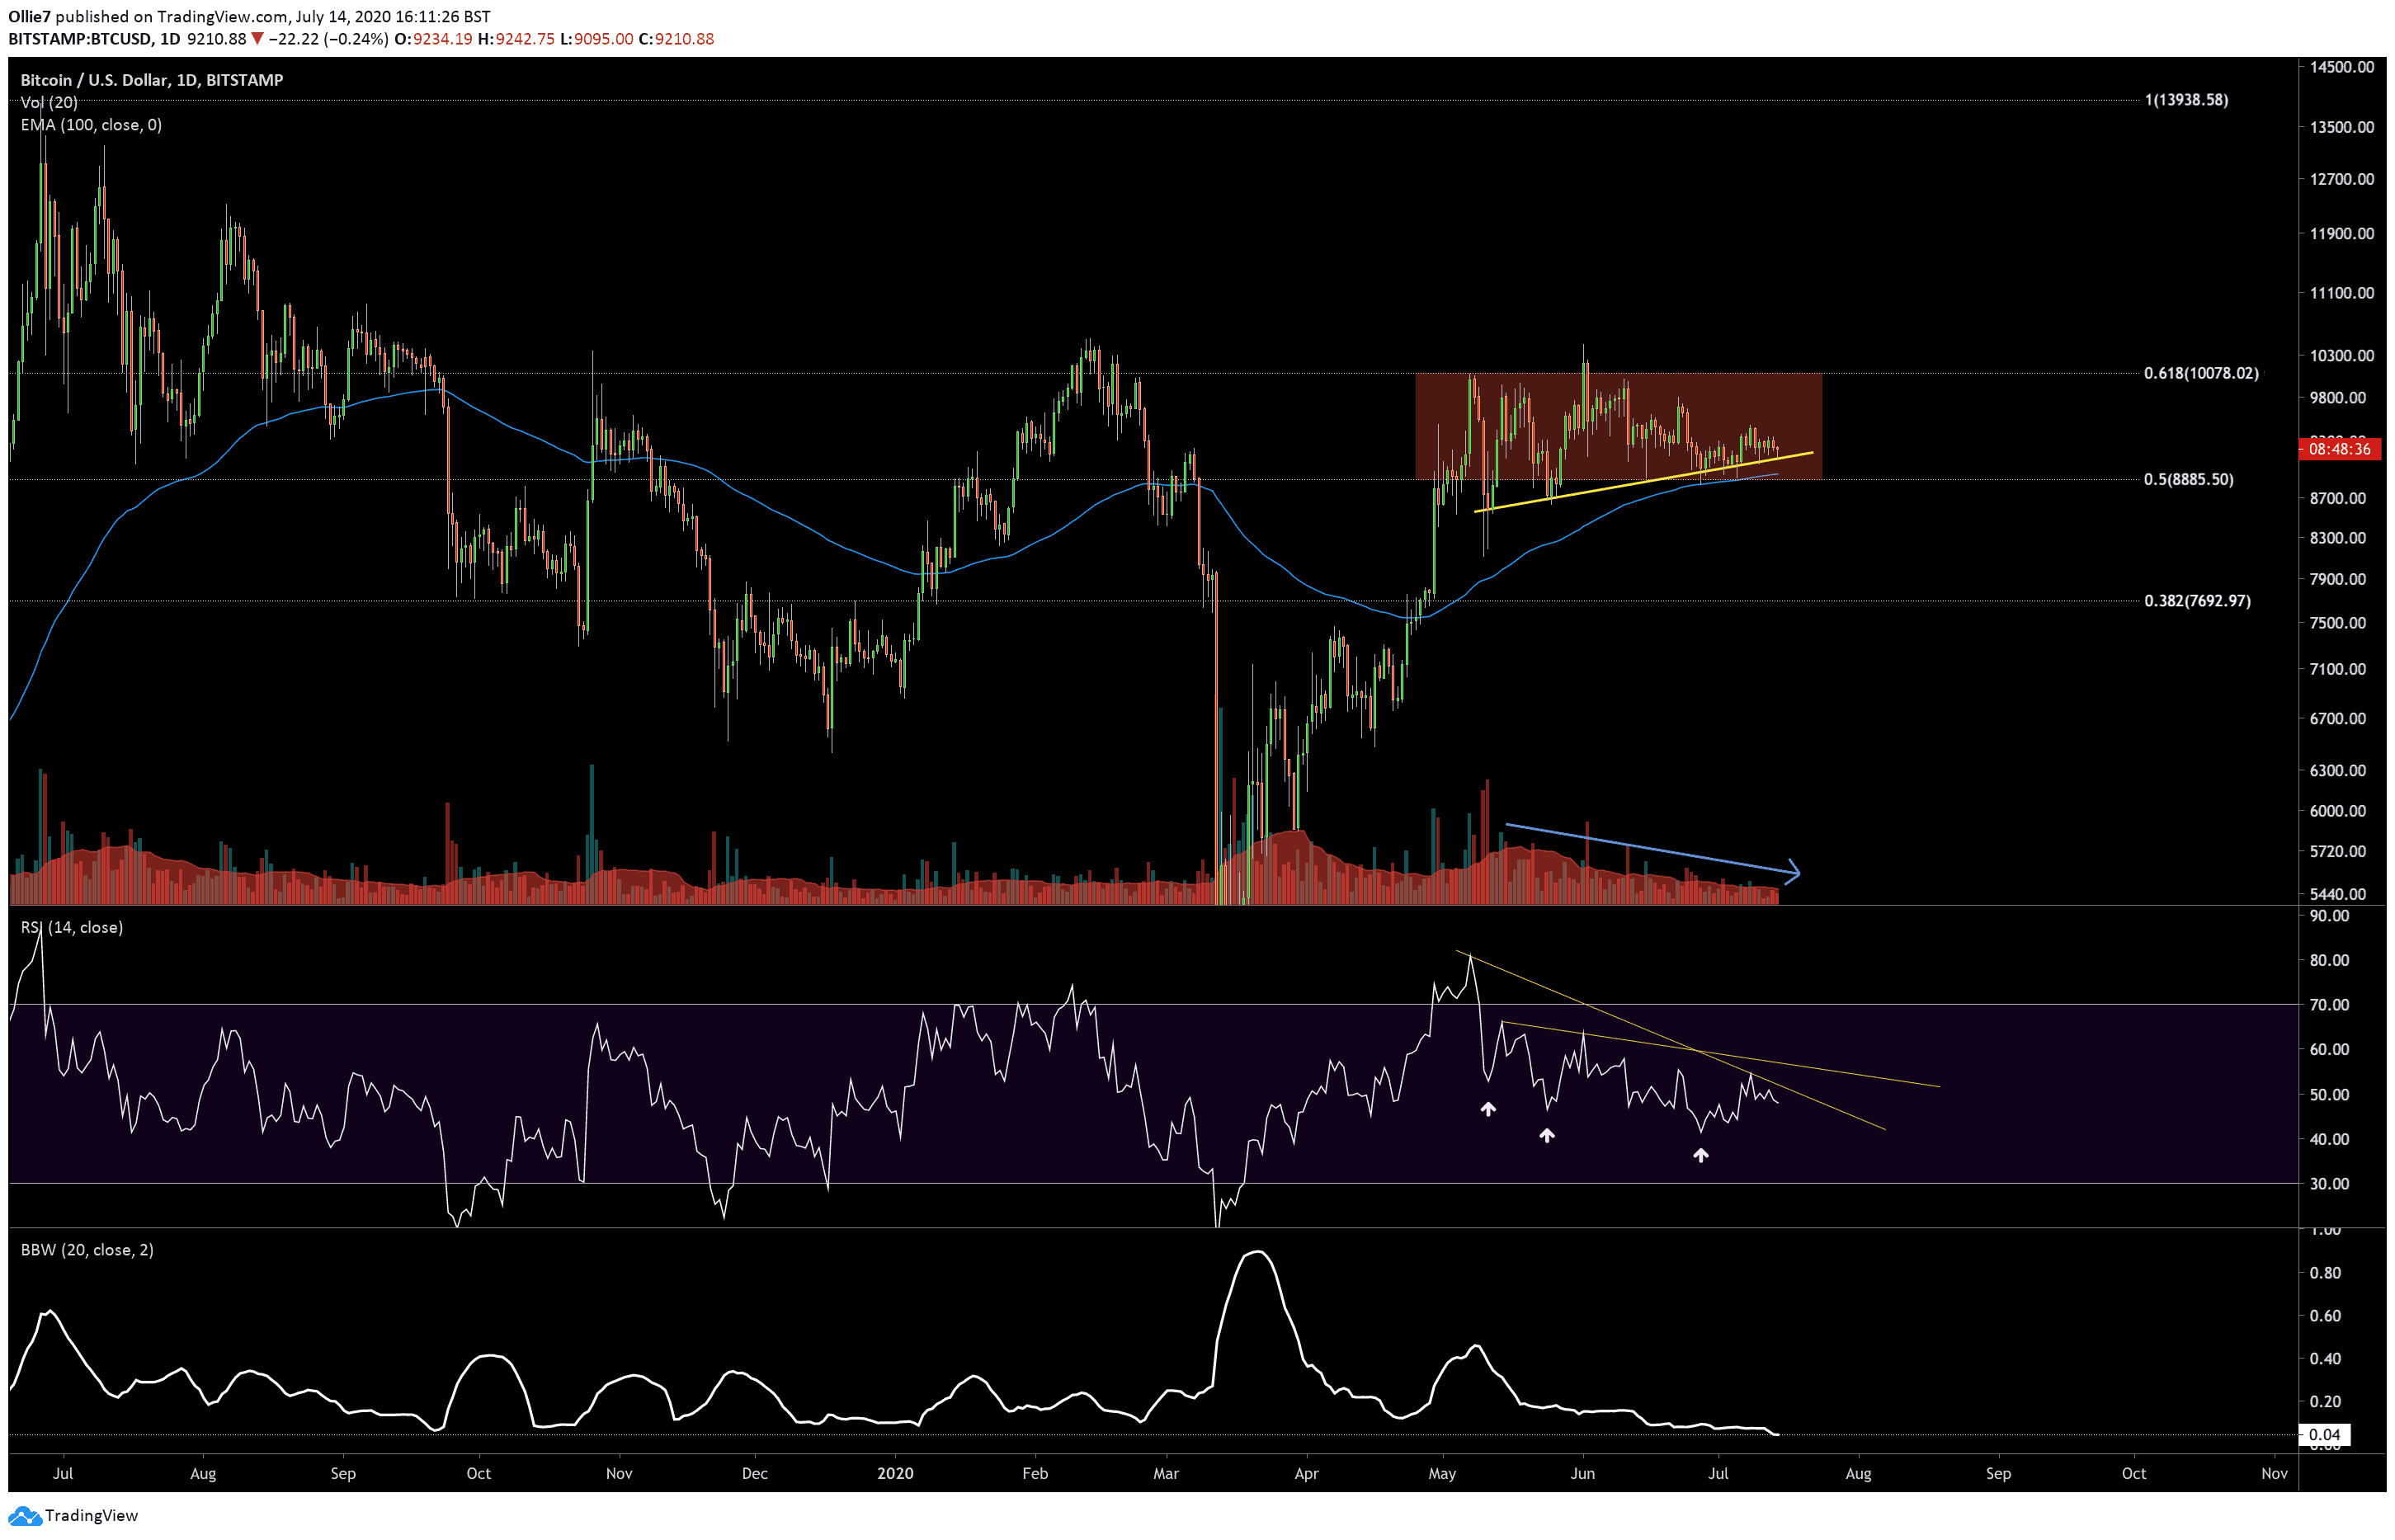
Looking at the daily BTC/USD chart more closely, we can see that the asset has generally been ranging between two key Fibonacci levels: the 0.5 level at $8,885, and the 0.618 level above at $10,078 (red area). Looking back at the recent fake-outs that occurred on May 24 and June 1, we can see that these particular levels were critical areas of high liquidity that whale traders tapped into to shake out smaller traders.
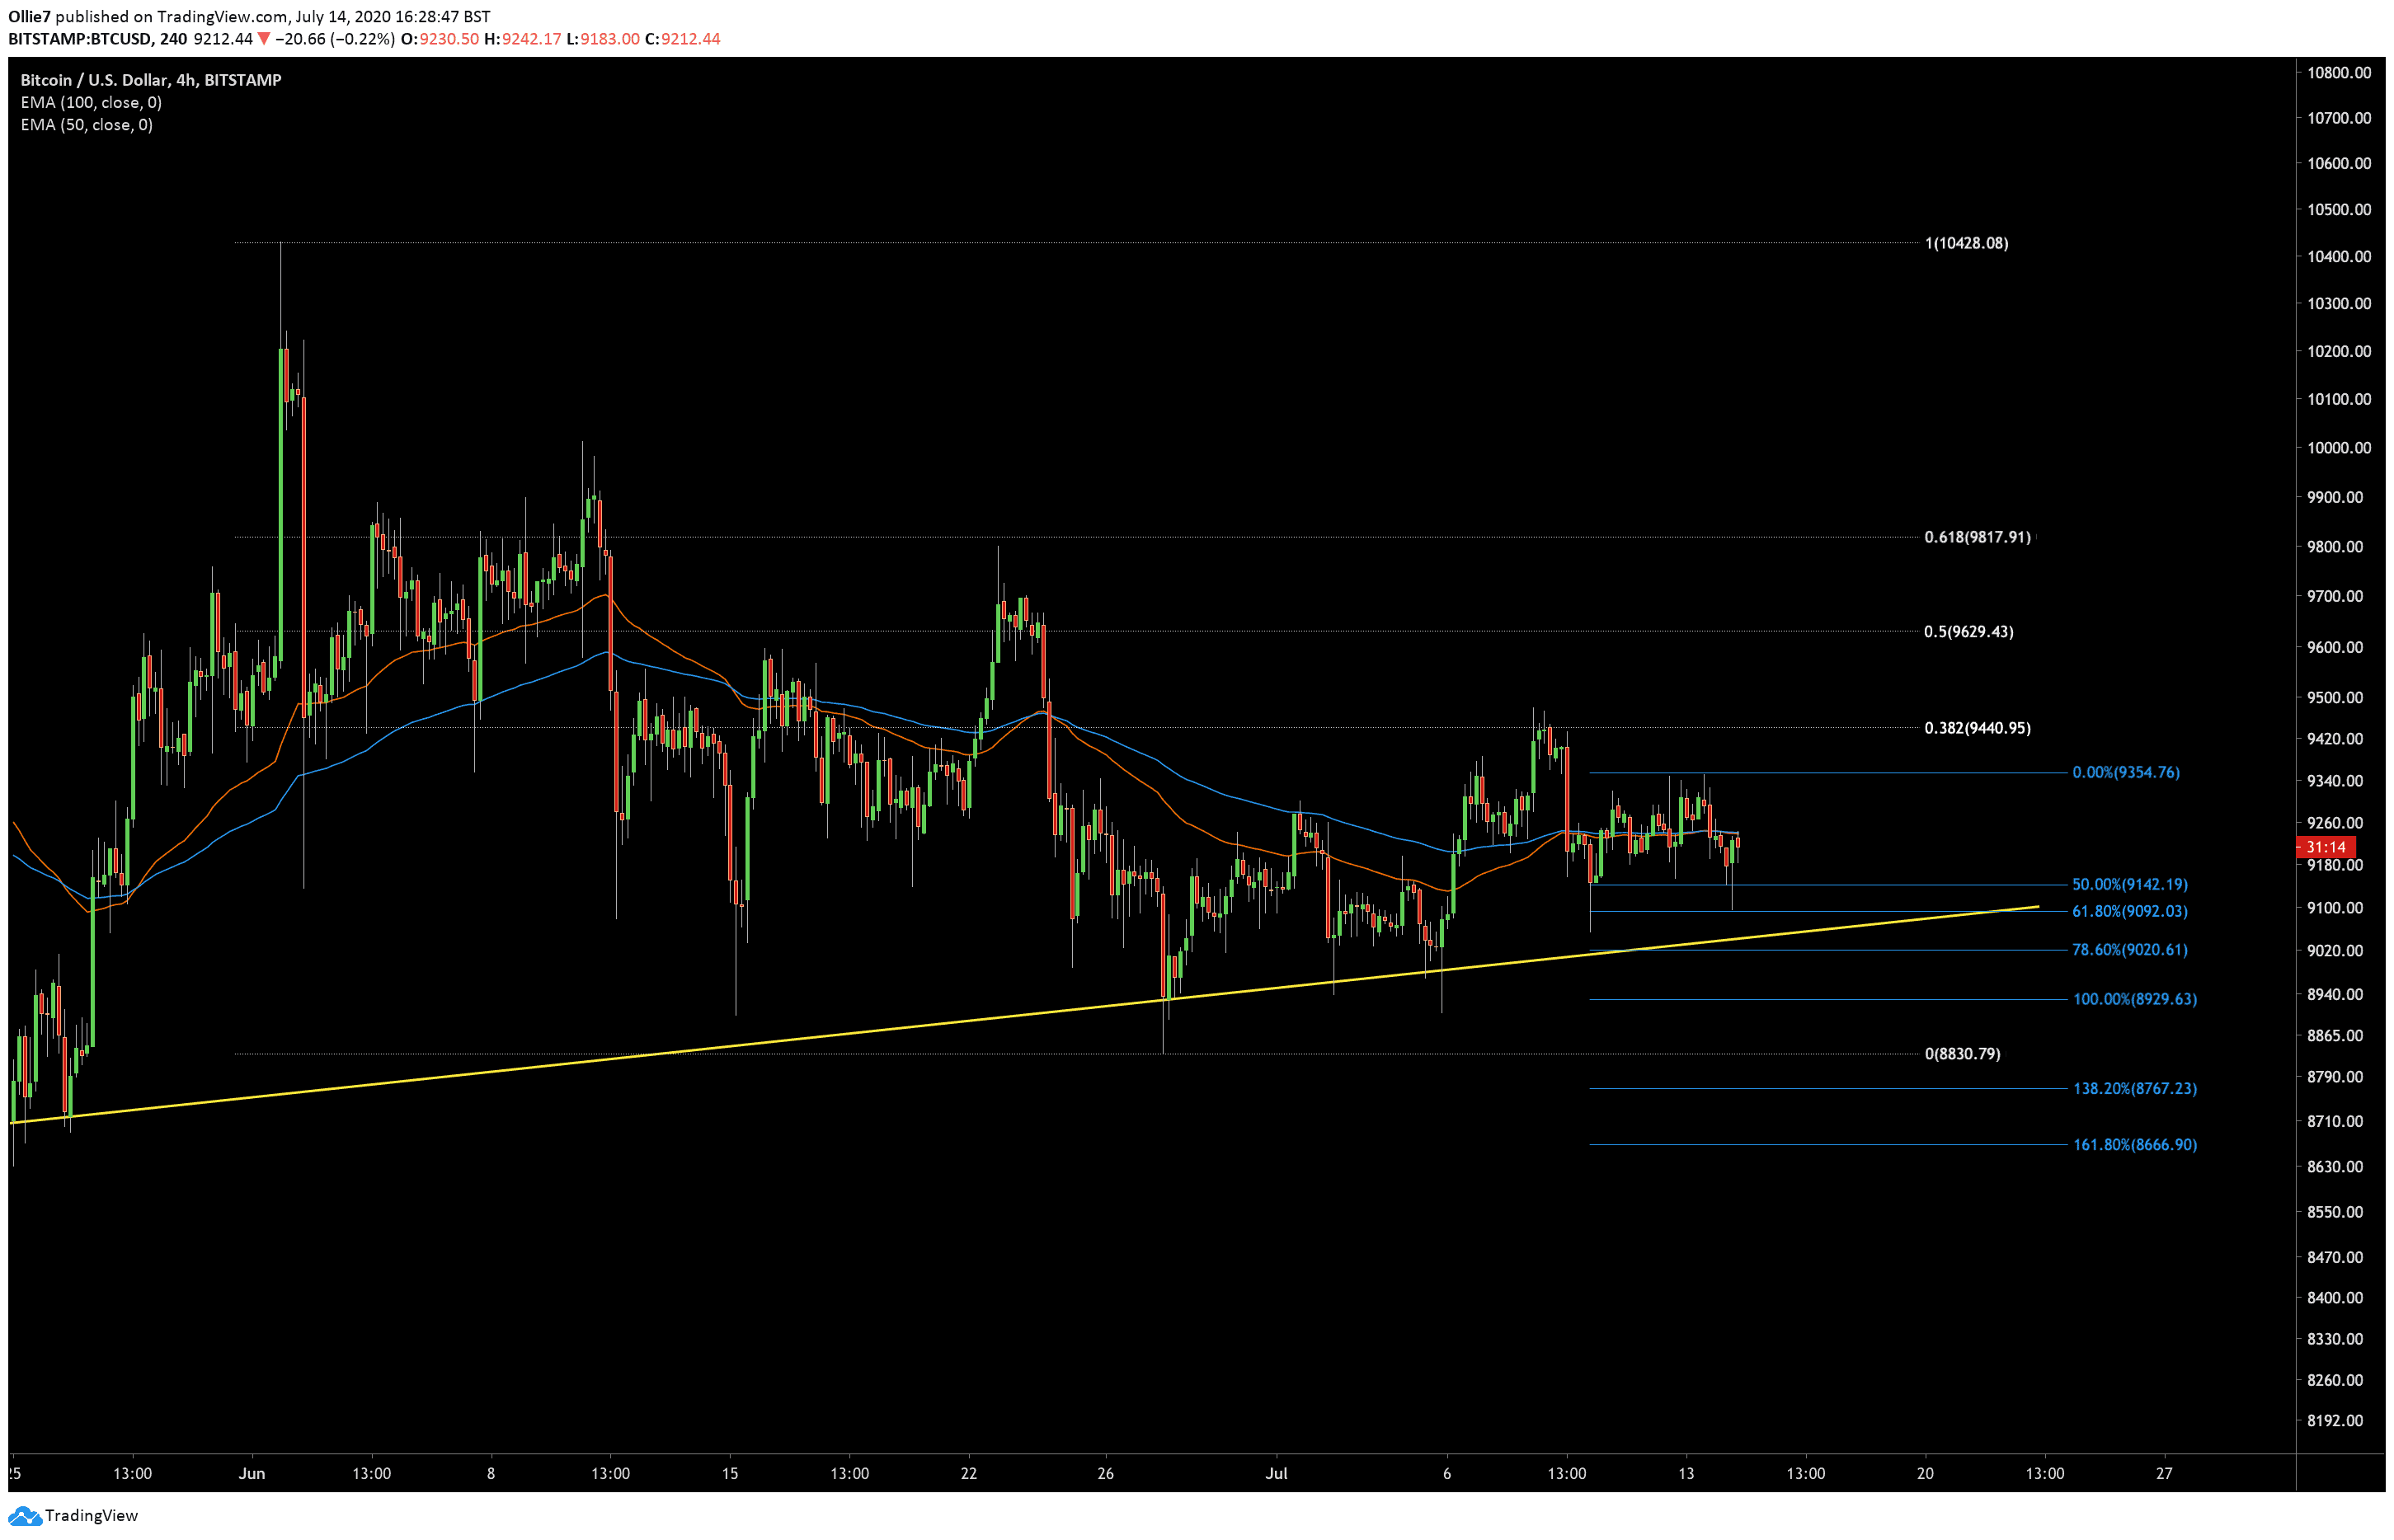
It’s possible that we might see another sharp movement down below the 0.5 fib level to create another opportunity for larger traders to buy back into BTC at a cheaper price, or they might try to simply trigger stop losses and cause Bitcoin’s price to cascade down to much lower support before attempting to buy back in.
If we do see a bearish breakout, the first area of likely support should be at the 100 EMA (blue line), which sits approximately at $8,940 (at press time). If the price action closes beneath this key support, then the $8,600 and $8,400 levels could create footholds for bulls to push back from.
For now, however, the up-trending line (yellow) will continue to be our primary support, particularly over lower time frames.
The Technicals
Right now, it’s hard to see a bullish case for Bitcoin.
Volume has been consistently decreasing since mid-May (blue arrow), and the daily RSI has been making consistently lower highs (yellow line on indicator). There’s even a worrying divergence on the RSI too, with three higher lows on the BTC/USD price chart printing three lower lows (white arrows) on the RSI.
This suggests that bulls have been growing progressively weaker over the recent weeks, and supports the idea that a bearish breakout is due.
The constricting Bollinger bands are also an indication that a period of higher volatility should arrive soon.
Total Market Capital: $276 billion
Bitcoin Market Capital: $169 billion
Bitcoin Dominance Index: 61.4%
*Data via Coingecko
BTC/USD Bitstamp Daily Chart
BTC/USD Bitstamp 4-Hour Chart