Just ahead of last night’s daily close, Bitcoin price exploded above $10,000 in a powerful break of the asset’s most important resistance, liquidating overleveraged shorts along the way.
But Sunday night’s daily price candle coming to a close also opened a new weekly price candle, which also triggered a TD 9 sell setup. It’s that signal that may have accurately called today’s flash crash in Bitcoin, reminding crypto traders to never underestimate the power of the TD Sequential indicator.
Bitcoin Flash Crash Called In Advance By TD 9 Sell Setup
With Sunday night’s weekly and monthly candle closed, a new week and month opened with it. June 1 kicked off with an explosive rally that seemed to put an end to the popular investment phrase “sell in May and go away.”
Bitcoin price rocketed ahead of last night’s daily close by over $600 and 6%, breaking above $10,000. The leading cryptocurrency by market cap has struggled with the resistance level for years now.
Related Reading | Bitcoin Price Flash Crashes $600 In Less Than 5 Minutes, Last Night’s Rally Erased
The pump brought the price of Bitcoin just high enough to perfect the sell setup on the TD Sequential indicator, which requires the 9 candle to push higher than the 7 or 8 candles before it.
Bitcoin held above $10,000 overnight, but this afternoon flash crashed by $600 and 6%, erasing the entire rally from last night in what the crypto market refers to as a “Bart” pattern.
Never underestimate the TD ! pic.twitter.com/rjVVxahstc
— Moe (@Moe_mentum_) June 2, 2020
One crypto analyst who pointed out the 9 sell setup ahead of last night’s crash, used the successful call to remind crypto traders to “never underestimate” the power of the TD Sequential indicator.
Why You Shouldn’t Underestimate The TD Sequential Indicator
In the image below, you can clearly see how the wick on the 9 candle extended higher than the previous several candles. It also touched a key resistance block that Bitcoin has been unable to close above on weekly timeframes.
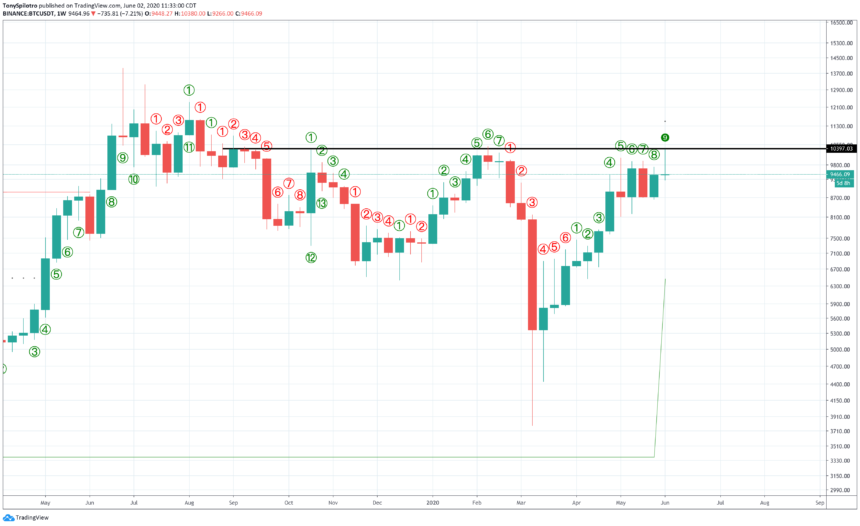
Also pictured above, a 9 candle can be seen at the top of the June 2019 rally that sent Bitcoin back into another year-long downtrend.
The TD Sequential indicator created by market timing expert Thomas Demark, has once again shown to the cryptocurrency world just how powerful and accurate the tool can be.
A TD 9 signal also called Bitcoin’s top at $20,000 in 2017, and bottoms at $3,200 and again at $6,400 in December of 2018 and 2019.
Related Reading | Top Cryptocurrency Assets Trigger TD9 Sell On Weekly Price Charts
The tool works extremely well with altcoins also. A TD 9 sell signal also triggered on various altcoins on weekly timeframes, including Etheruem, Chainlink, Cardano, and many more.
Given how accurate the signal can be, the rally from $4,000 to $10,000 may now be complete, and a strong correction could soon follow.