Bitcoin (BTC) failed to sustain its upward movement on Feb 23 and is now approaching its yearly lows once more.
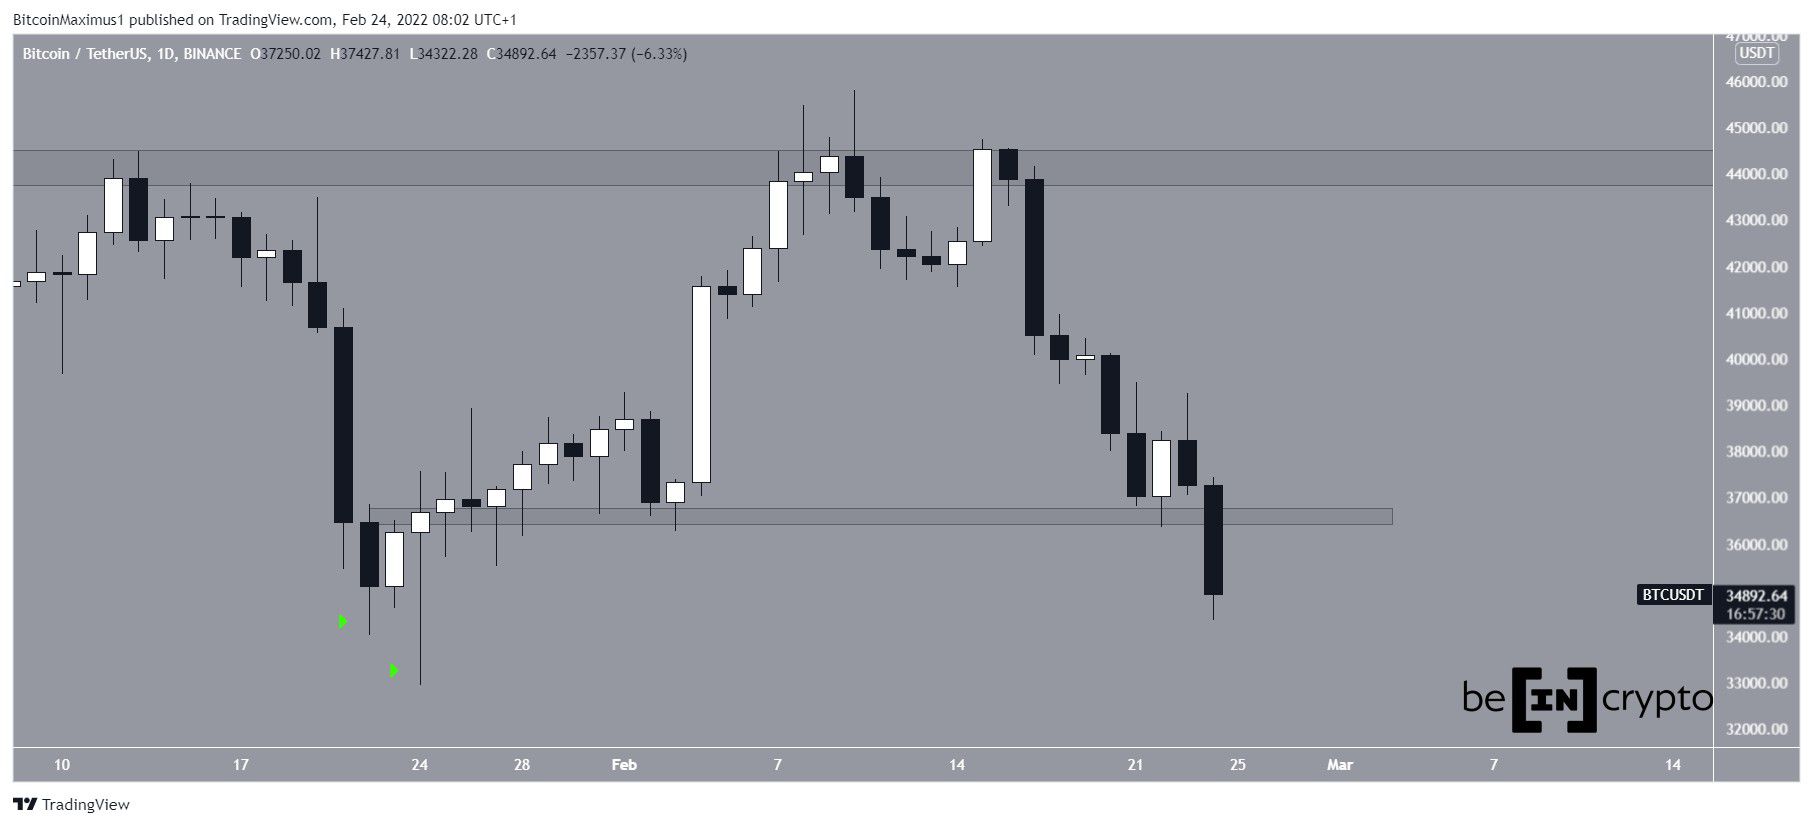
Bitcoin attempted to move upwards on Feb 23, but was quickly rejected and fell sharply. The dip continued on Feb 24 and BTC broke down from the $36,600 horizontal support area.
BTC is now approaching the January lows of $32,900 (green icons). The previous time this area was reached, BTC created a long lower wick and rebounded.
Bearish readings
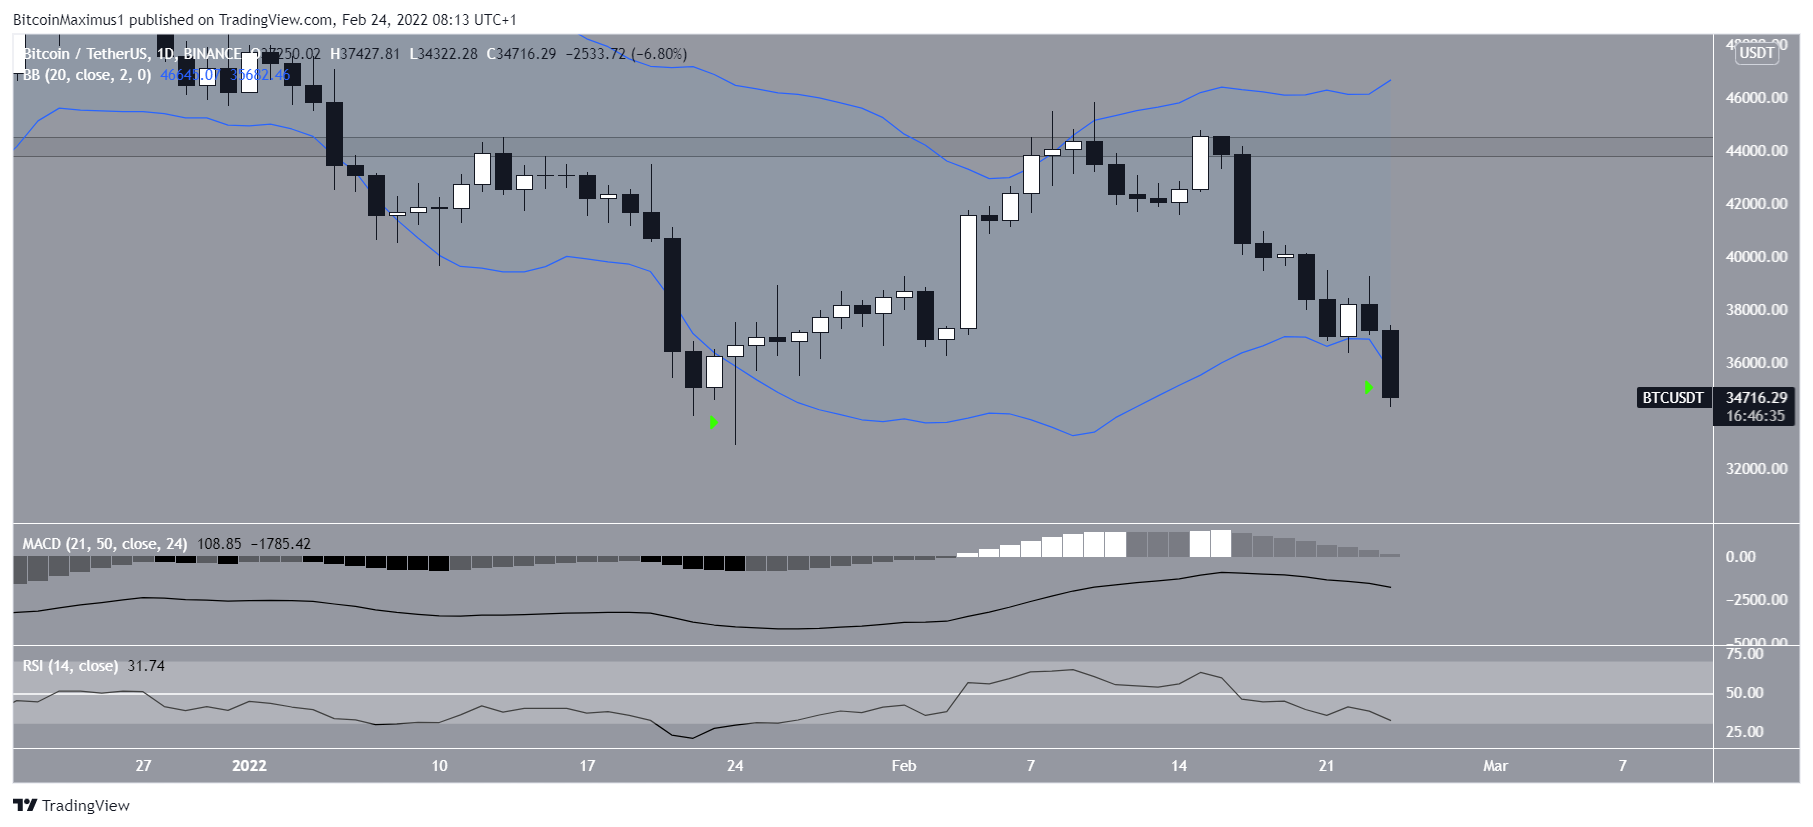
Technical indicators in the daily time frame are bearish since both the RSI and MACD are decreasing. The former is below 50 while the latter has already crossed into negative territory. Both of these are signs associated with bearish trends.
On the bullish side, the price has just dropped below the lower Bollinger band. While this could be the catalyst for a short-term bounce, it does seem that the trend is still bearish.
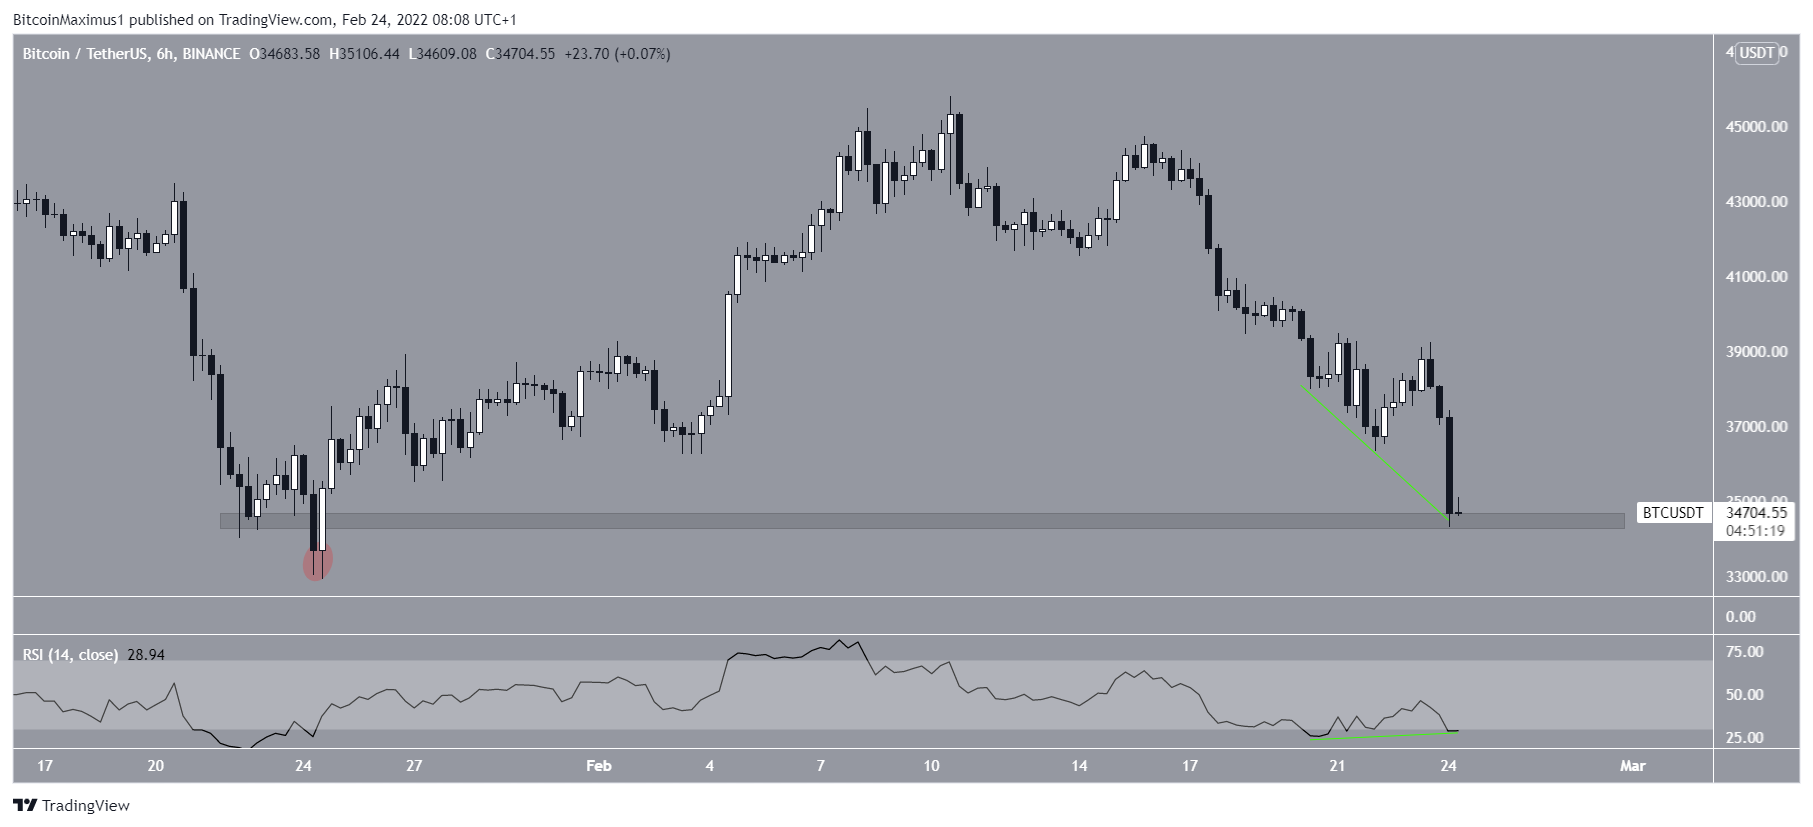
The six-hour chart shows that BTC is hovering just above the $34,500 horizontal support area. Previously, it deviated below this level on Jan 24 before reclaiming the line.
Furthermore, there is a short-term bullish divergence that is slowly developing in the RSI. This aligns with the reading from the Bollinger Band, which suggests that a short-term rebound could transpire.
However, the longer-term trend is likely bearish.
BTC wave count analysis
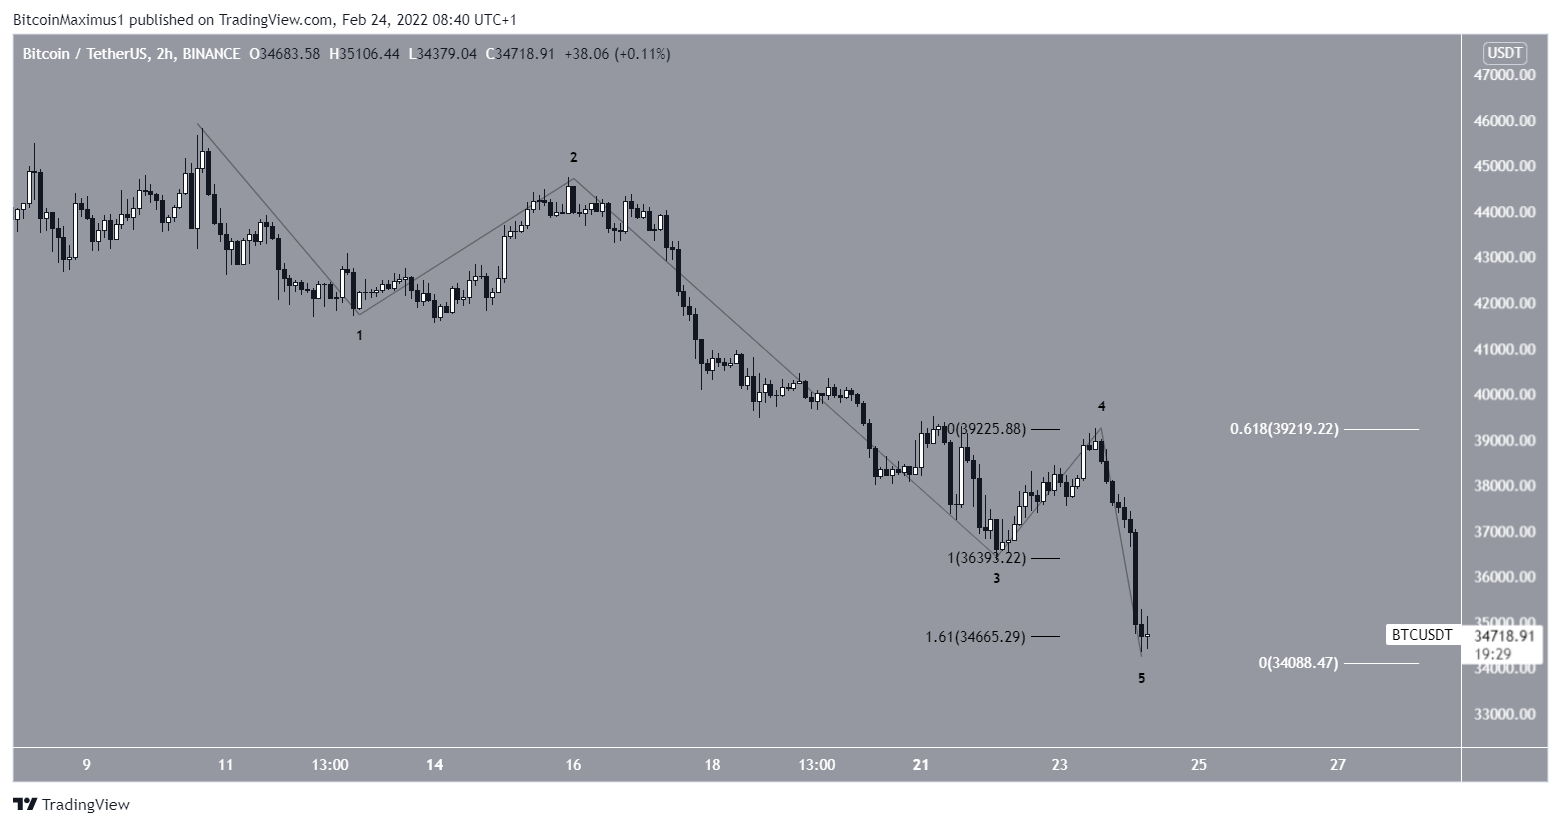
The wave count suggests that BTC began a five-wave downward movement on Feb 11 (black). If true, it’s currently in the fifth and final wave.
The price is currently trading at a confluence of support levels that could act as the bottom of wave five. The level also coincides with the 1.61 external retracement level of wave four (black), and the 0.618 length of wave three (white).