After a bloody week, the bitcoin price is slowly recovering, following a 50% drop since recording the ATH level of $69K during November 2021. The following analysis will discuss two possible scenarios going forward, from a technical point of view.
Technica Analysis
By: Shayan
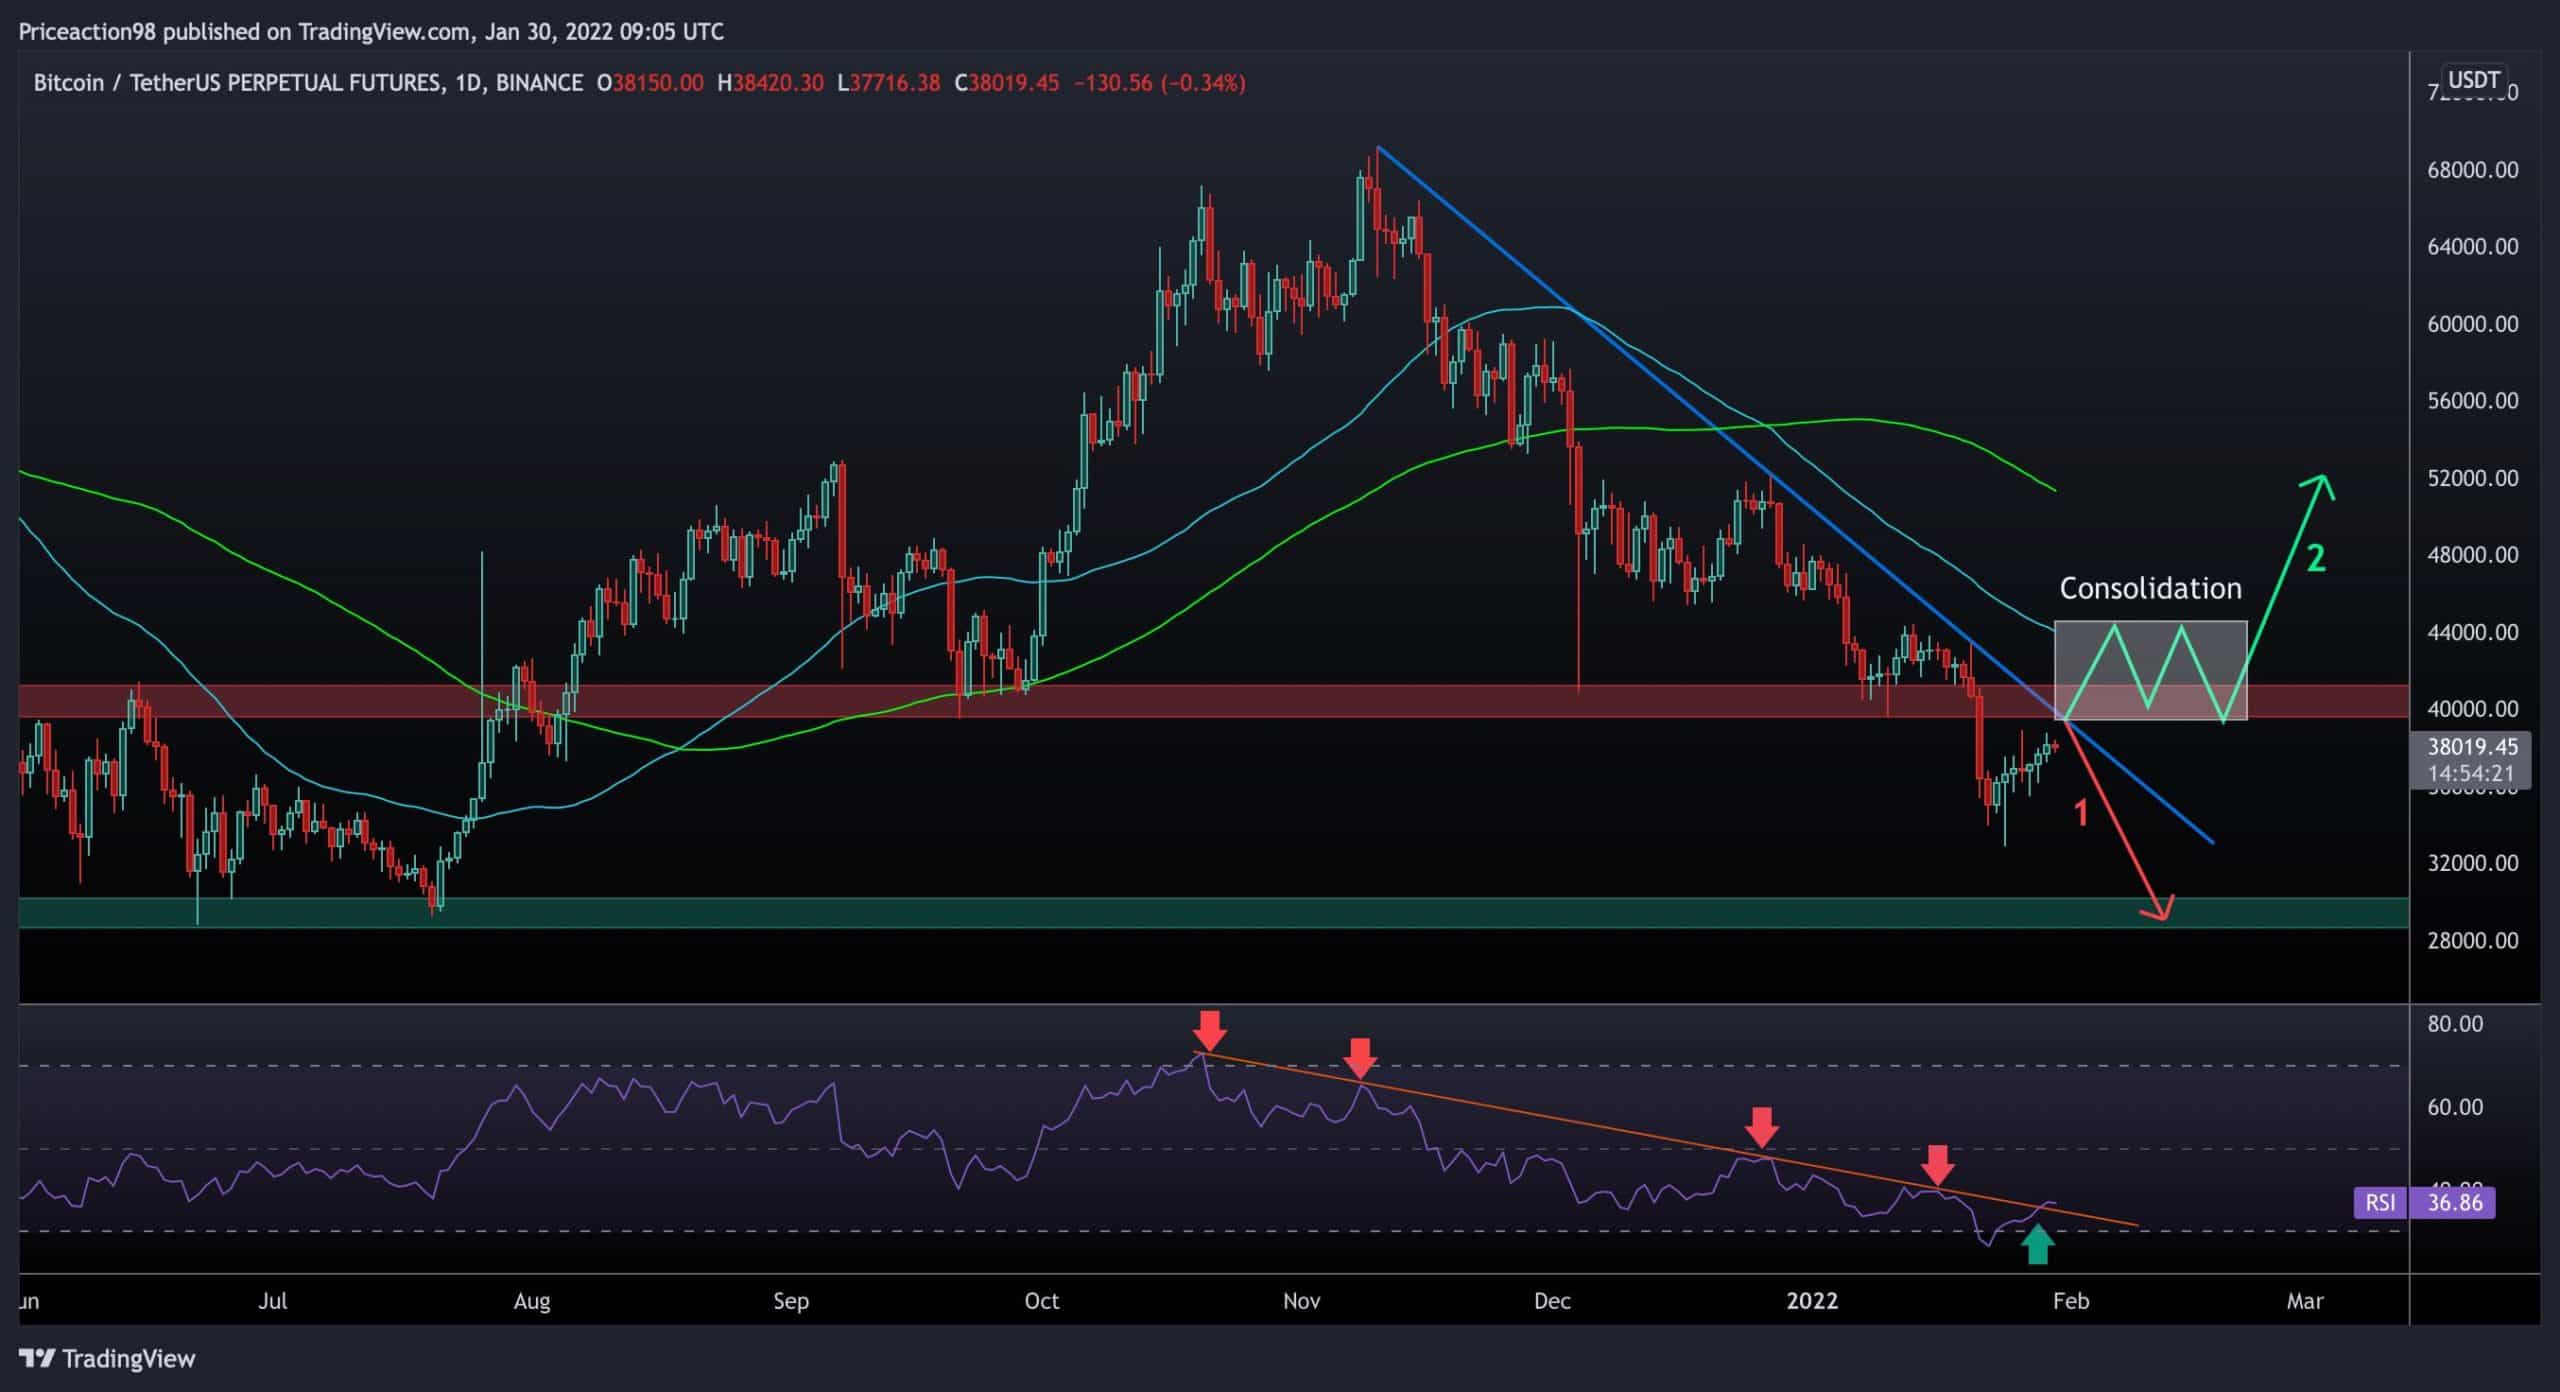
Long-Time Frame: The Daily
Looking at the daily chart, the BTC price has been recovering since it plunged over 50%, plunging below $33K last Monday.
However, Bitcoin is still beneath two critical resistance areas right now. First is the blue bearish trendline pushing the price down each time BTC attempted to break above it, and the second zone is the range marked in red between $39K and $41K.
On the other hand, the daily RSI has broken out of the multi-month low sloping resistance. The two previous breakouts had led to huge bullish moves over the past year.
In conclusion, the two likely scenarios are :
- Breaking above the descending trendline and the red area (around the $40K zone), consolidate above the zone for a while, generate a pullback to the resistance, and begin a price rally into the $50-60K channel.
- Getting rejected by both the trendline and the horizontal resistance area, forming a new lower-high to confirm the bearish trend, then a drop to lower price levels and test support zones to develop a new local bottom.
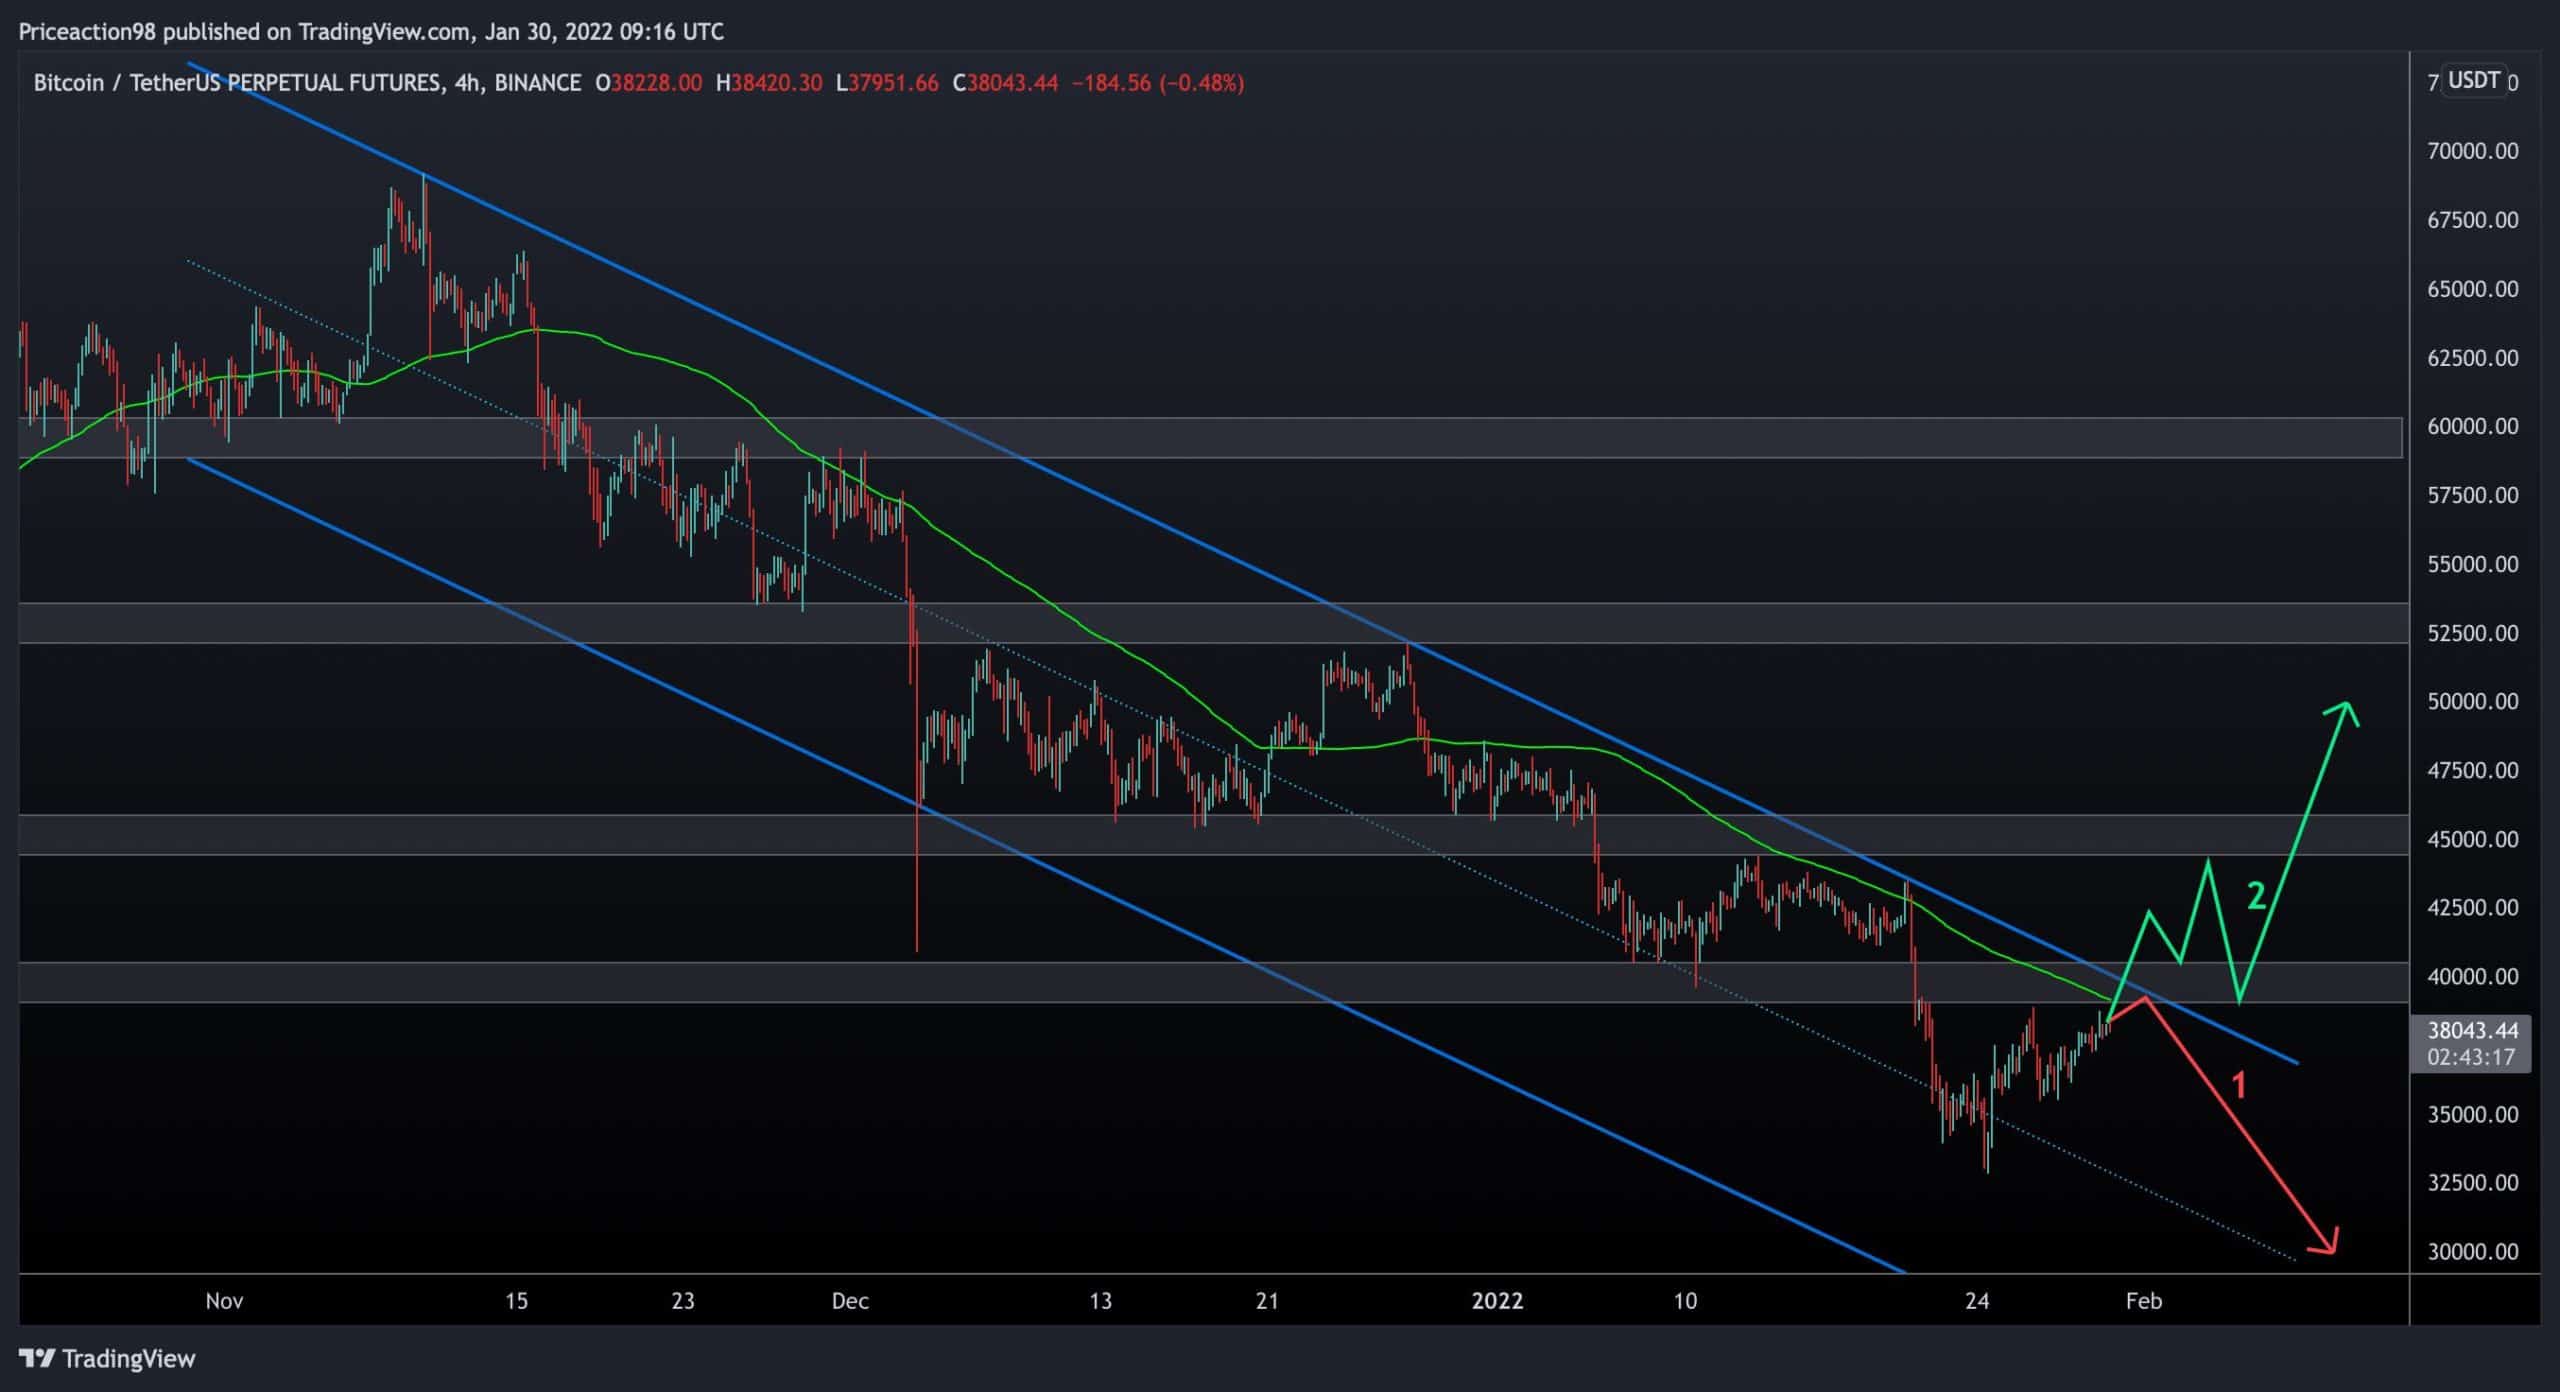
Short-Term Time Frame: The 4-hour
Bitcoin has multiple resistance levels in the lower timeframes (LTF), as indicated in the following chart. The price has created lower highs and lower lows inside a solid bearish descending channel.
The price is now trading below the 100-MA line and the channel’s upper trendline. As a result, if the market is set to bounce back and begin a newly bullish rally, it is required to break out of the trendline and complete a new higher high, as shown by the green path.
The other scenario is that the price touches the trendline, records a new lower high, and then gets rejected on its way to retest lower price levels (the red path).
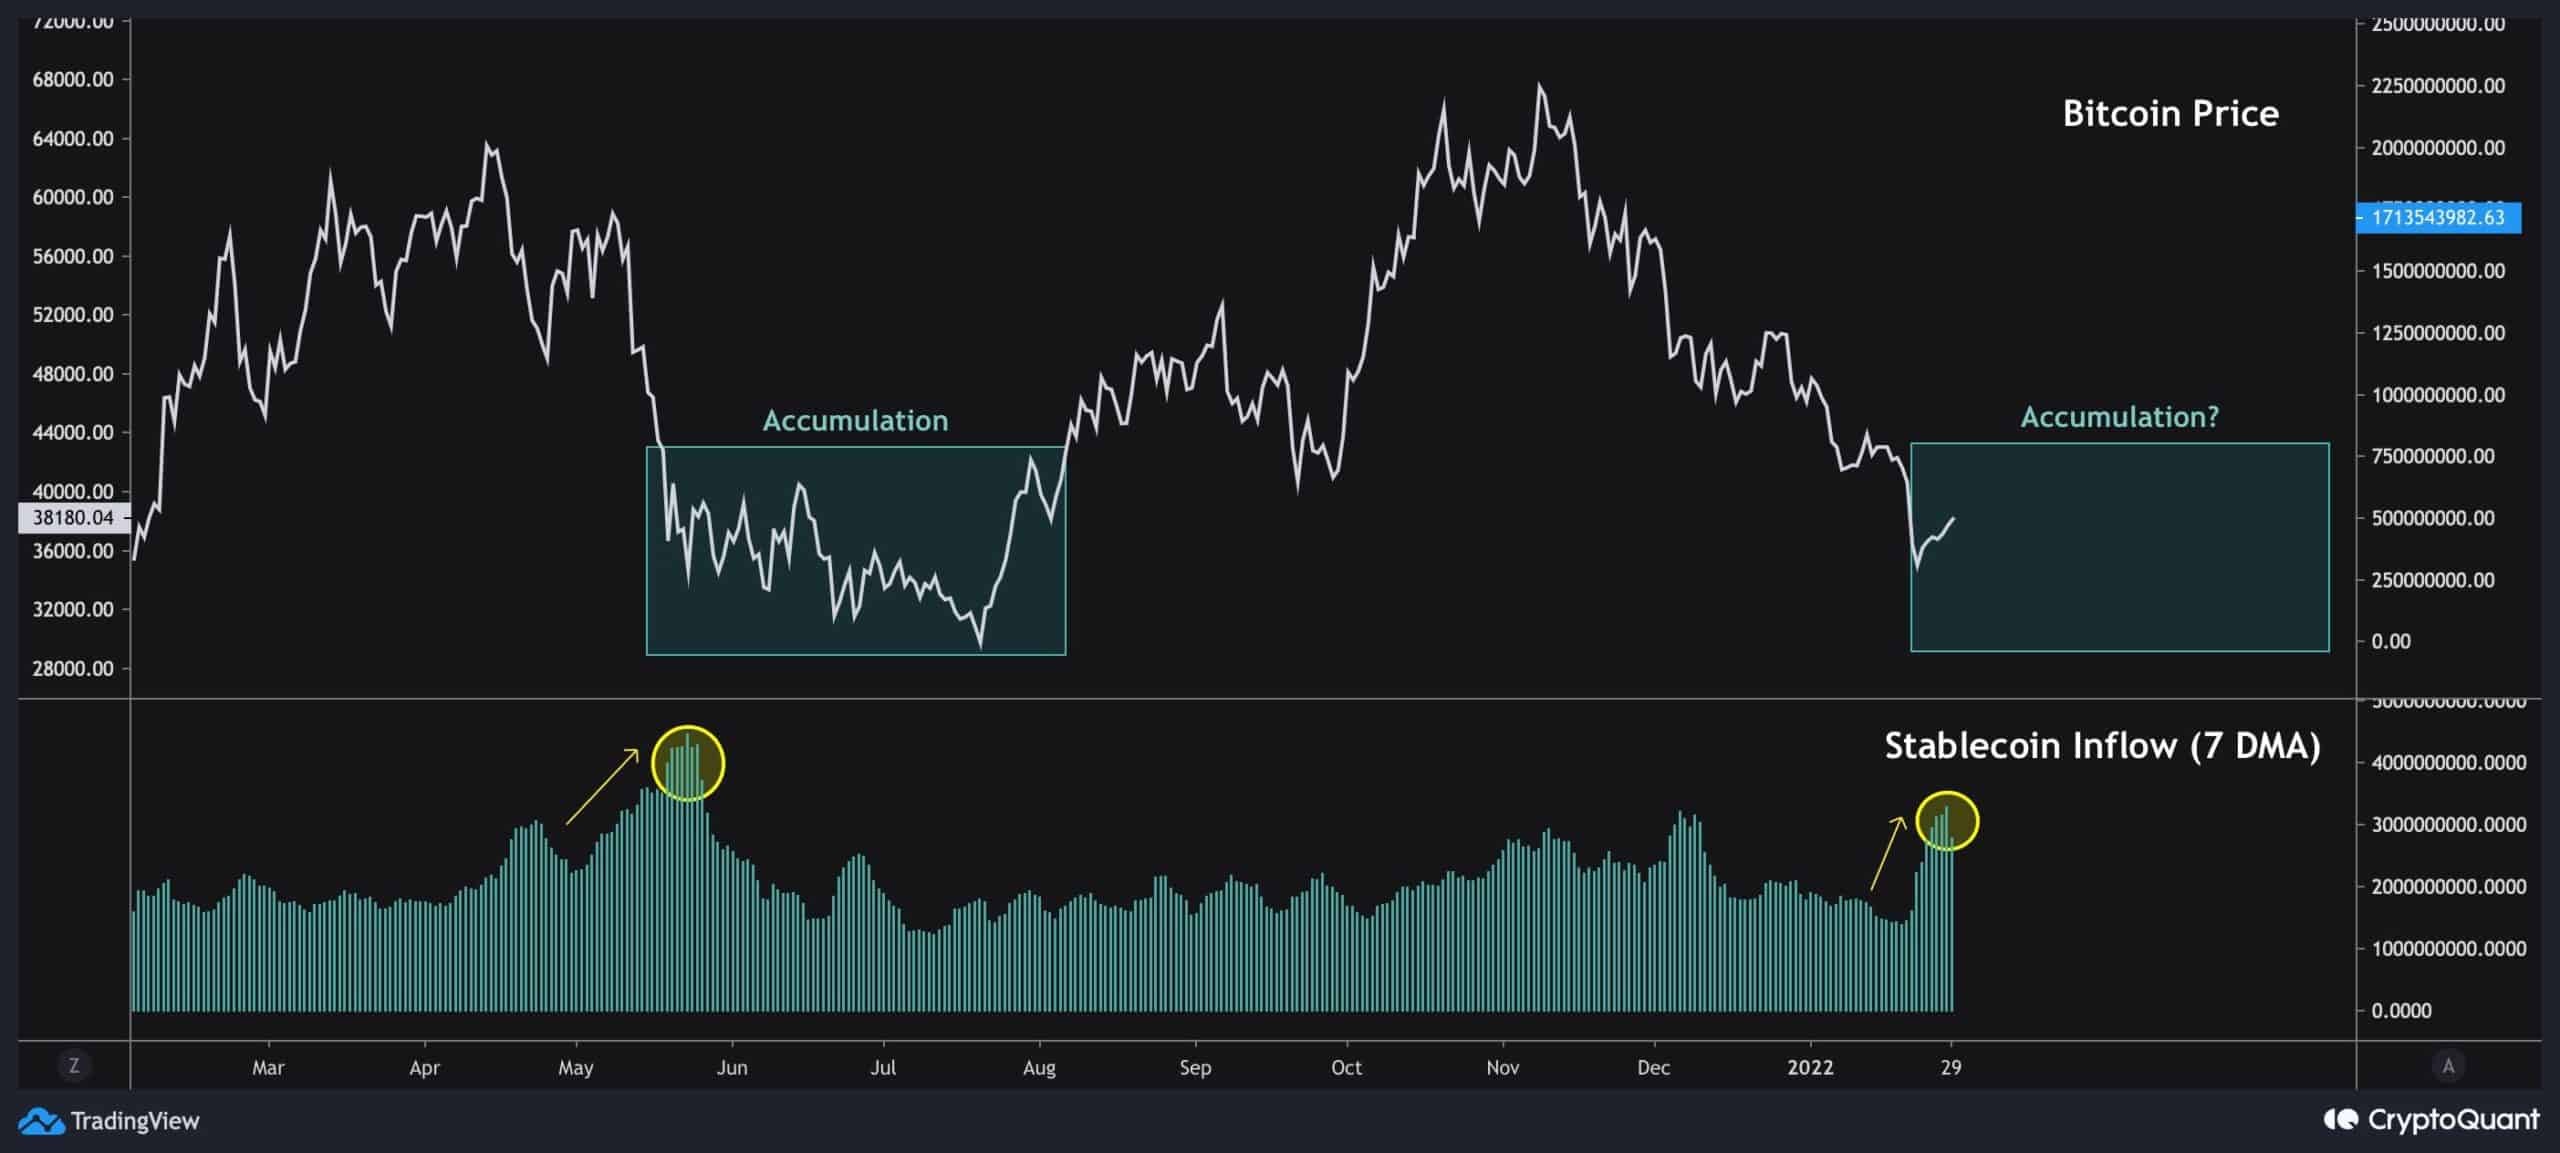
Onchain Analysis: Stablecoin Inflow
By: Edris
The following chart consists of BTC price and the 7-day moving average of stablecoin inflow.
As you can see, there has been a significant rise in the volume of stablecoins deposited into exchanges over the past few days.
The last time we witnessed such a sharp increase in this metric was in May 2021, following the crash to the $30k range. This suggests that liquidity is ready to buy the dip. However, accumulation phases after huge market crashes usually take a while. So, it may take a few weeks or even months before a price rally happens, just like last year.