Bitcoin (BTC) has bounced at a minor support level and looks to be gearing up for a short-term breakout above a descending resistance line.
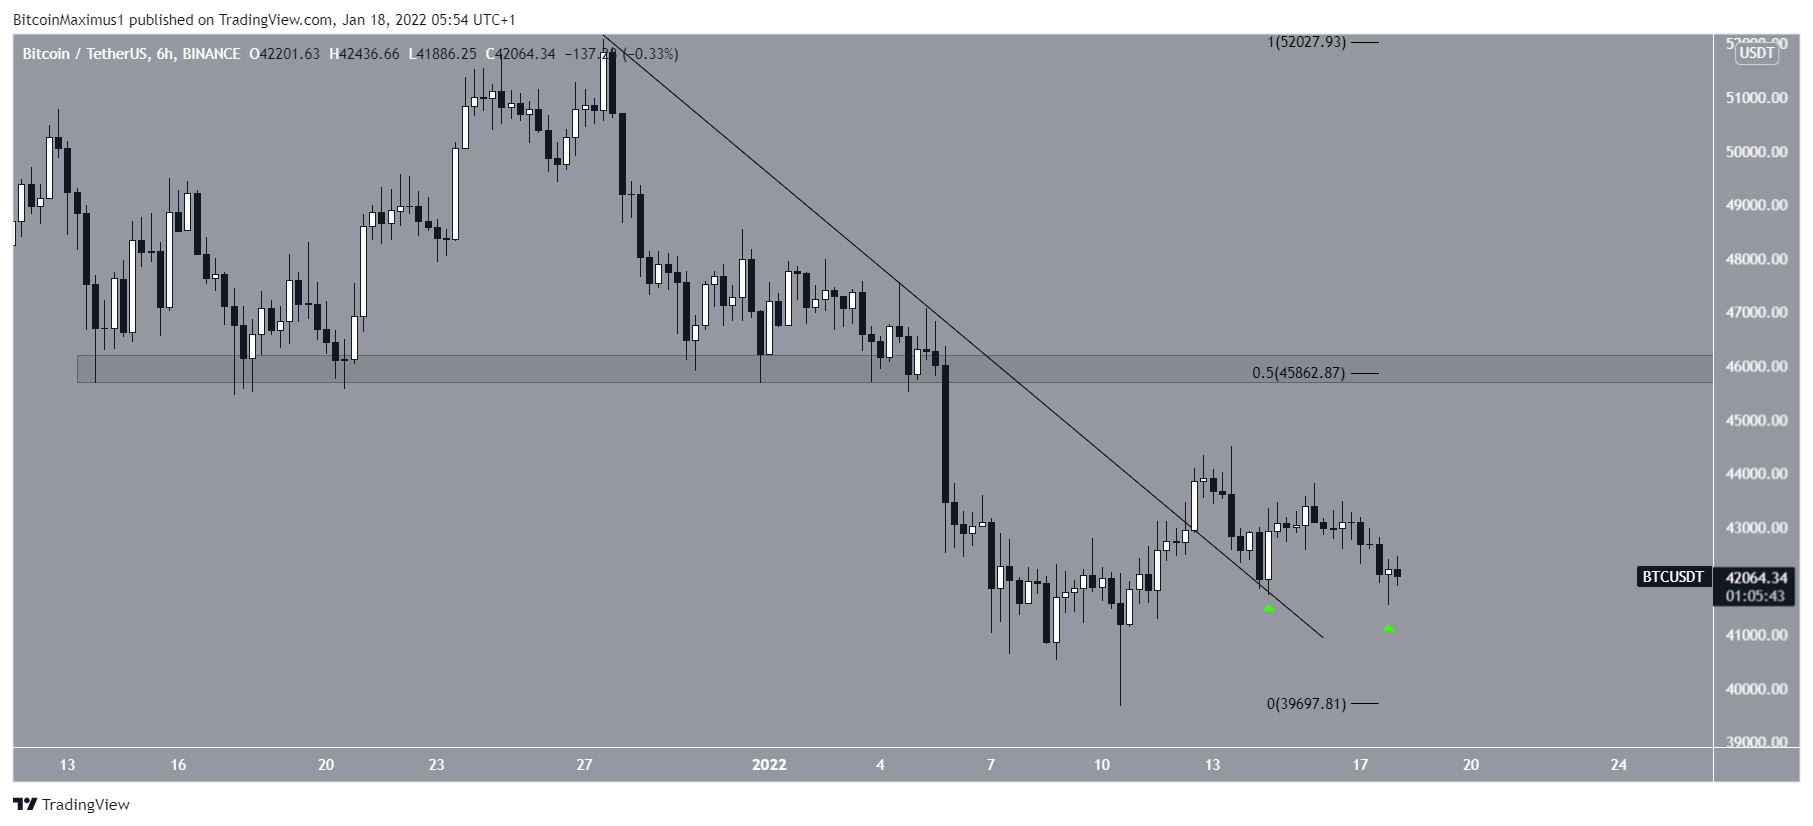
Bitcoin broke out from a descending resistance line on Jan 12 and validated it as support two days later (green icon). After a weak bounce, it created a slightly lower low on Jan 14.
It then rebounded once again, creating another long lower wick. This is often considered a sign of buying pressure.
The closest resistance area is found at $45,850. This is the 0.5 Fib retracement resistance level and a horizontal resistance area.
Short-term BTC movement
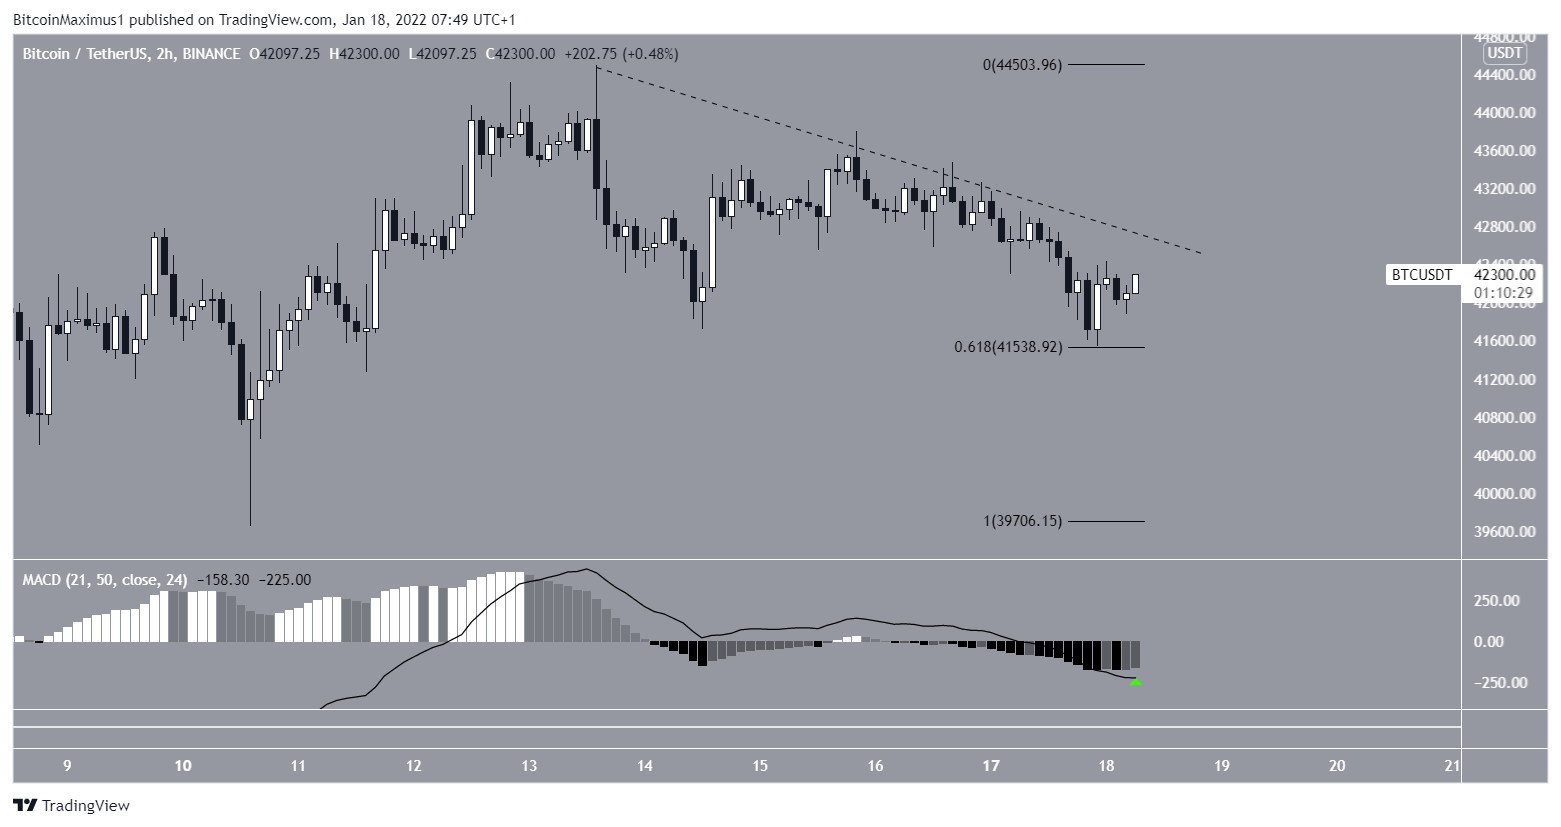
The two-hour chart is showing some bullish signs, but not enough to confirm a bullish reversal.
Firstly, BTC bounced right at the 0.618 Fib retracement support level of $41,538. This is a common level for corrections to complete their cycle.
Secondly, the MACD is in the process of creating successive higher momentum bars, even though the second bar has yet to close. The MACD is created by short and long-term moving averages (MA), and the higher momentum bars suggest that the short-term MA is picking up steam relative to the long-term average. This usually occurs during the beginning of bullish trends.
A breakout from the short-term descending resistance line (dashed) would be required in order to confirm a short-term reversal.
Wave count analysis
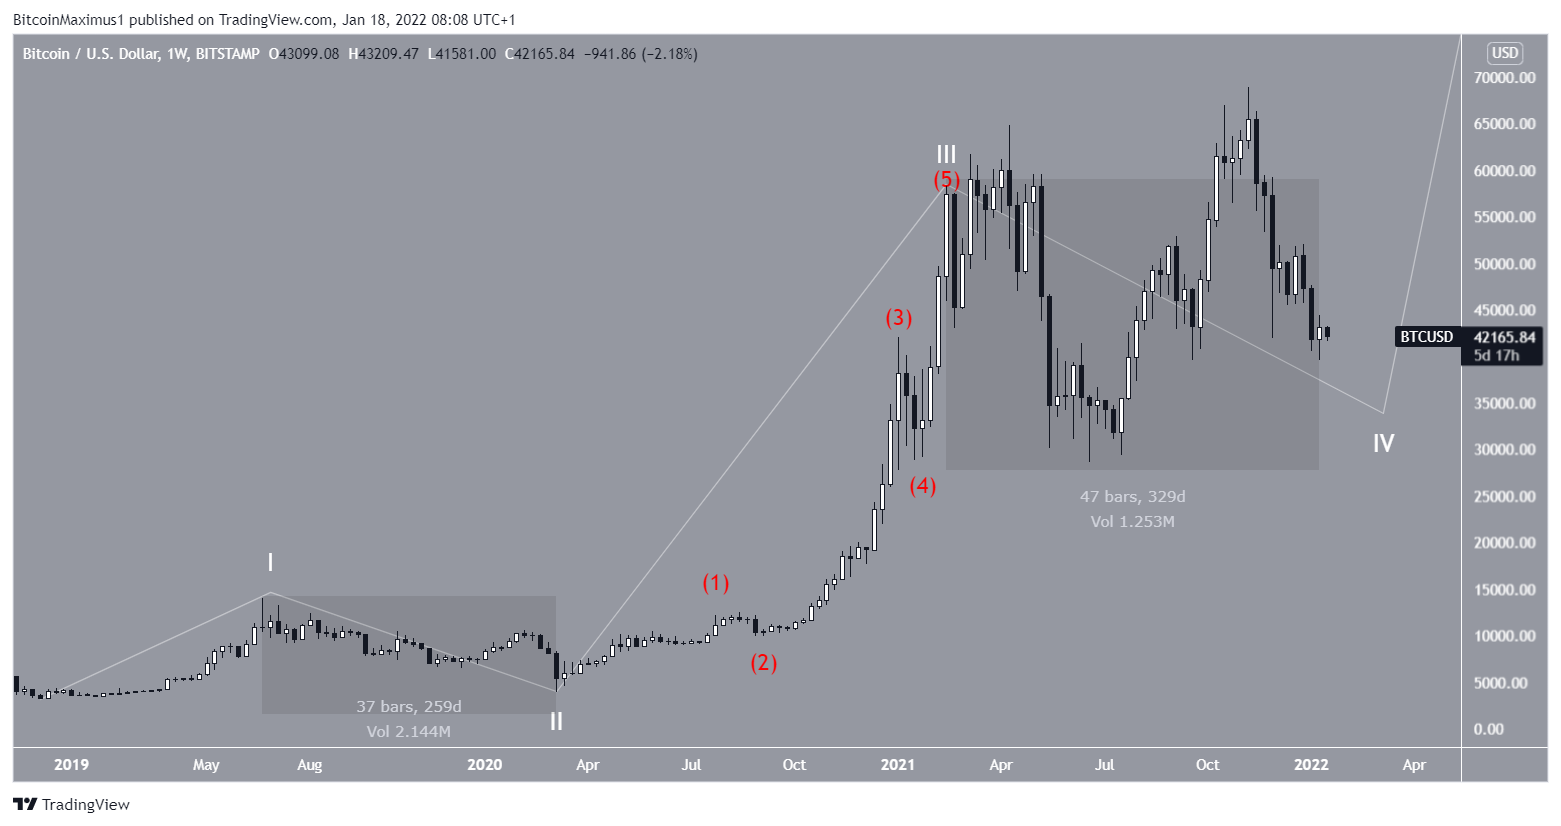
The long-term wave count suggests that BTC is currently in wave four of a five-wave upward move that began in December 2018.
Wave two took 259 days to develop (highlighted) while wave four has so far taken 329 days. However, the short-term count of wave four is still unclear.
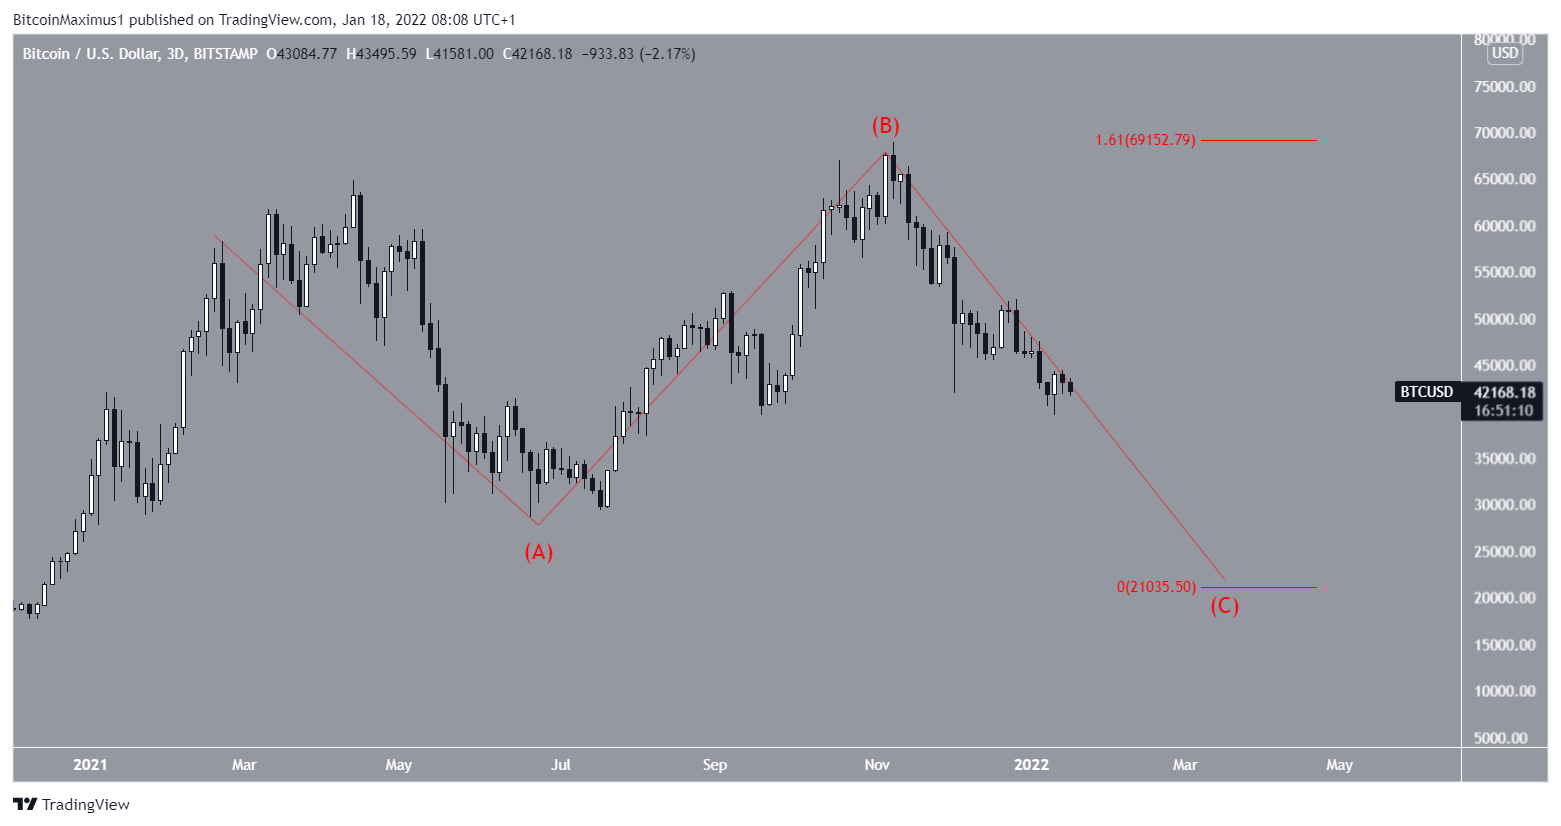
The most bearish count suggests that BTC is in an expanded flat correction. This means that wave C is 1.61 times longer than wave A. If true, it would mean that the correction will continue and BTC could fall all the way back to $21,000.
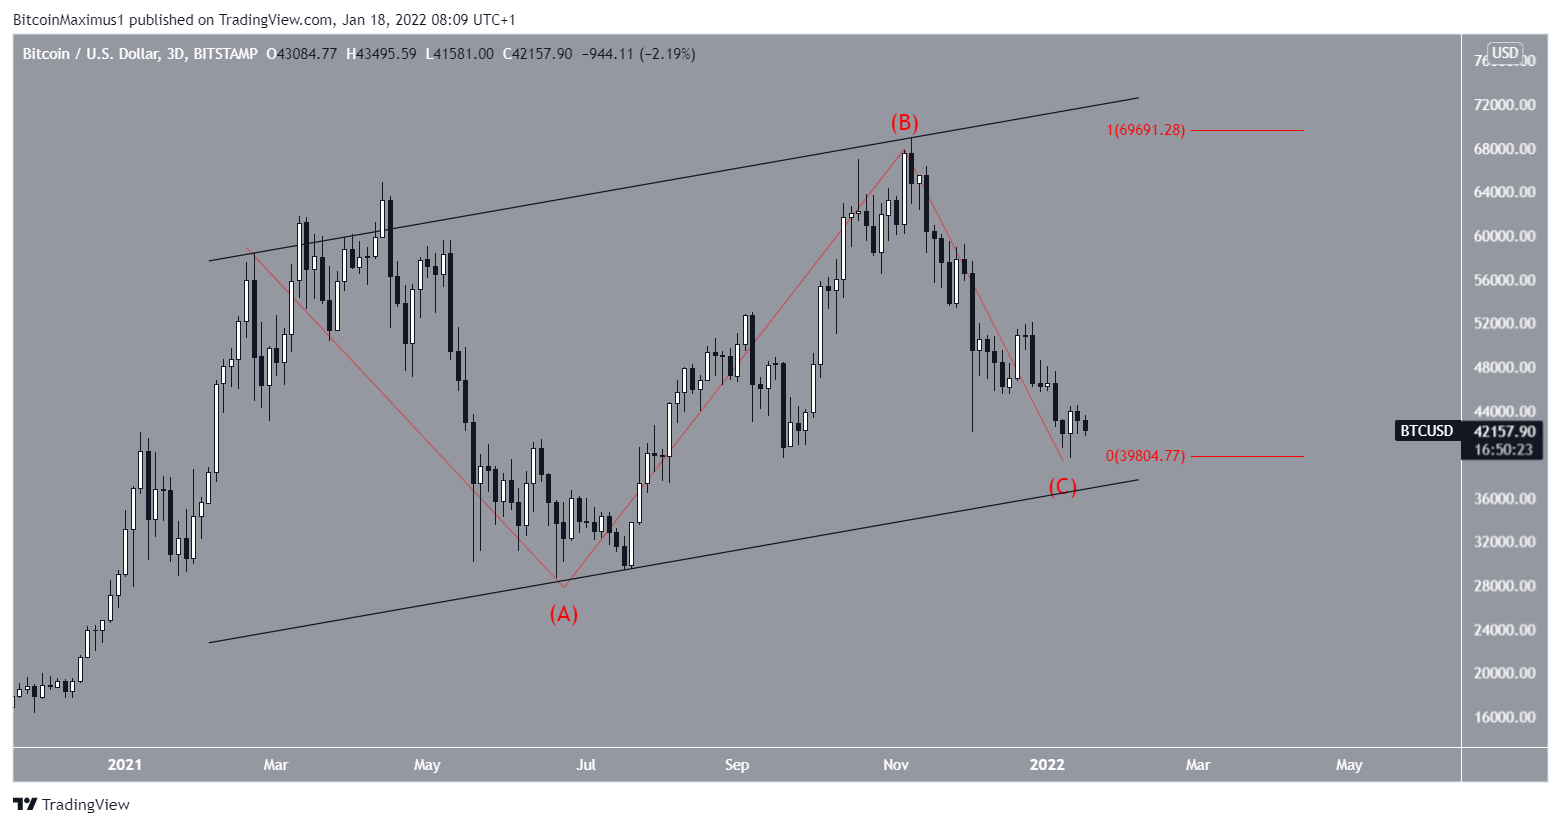
The second possibility suggests that BTC has completed, or is very close to completing, a regular flat correction. This is a type of correction in which waves A and C have a 1:1 ratio.
Considering that the previously outlined long-term wave four is already longer than wave two, this would make sense as a completed pattern.
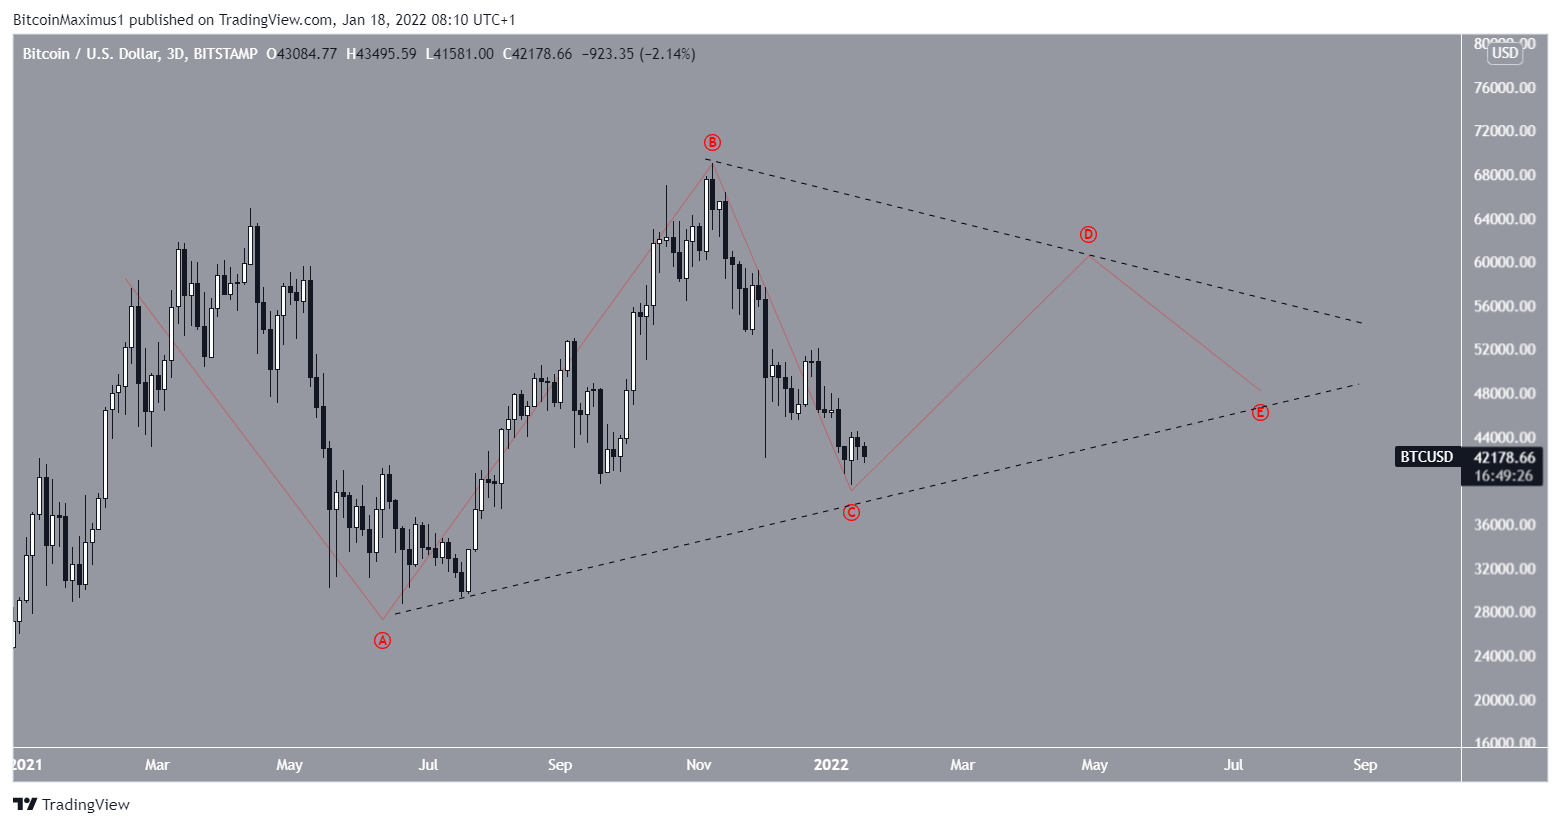
The least likely possibility would have BTC trading in what is known as a fourth wave triangle. If correct, the pattern would take several more months to bounce between support and resistance.
Since this would create a very significant time difference relative to wave two, it does not seem likely.