Bitcoin may soon go through high levels of volatility as a significant number of outstanding derivative contracts are scheduled to expire tomorrow. Multiple technical indexes and renowned analysts estimate that a bearish impulse is coming before a sharp rebound.
The Lull Before the Storm
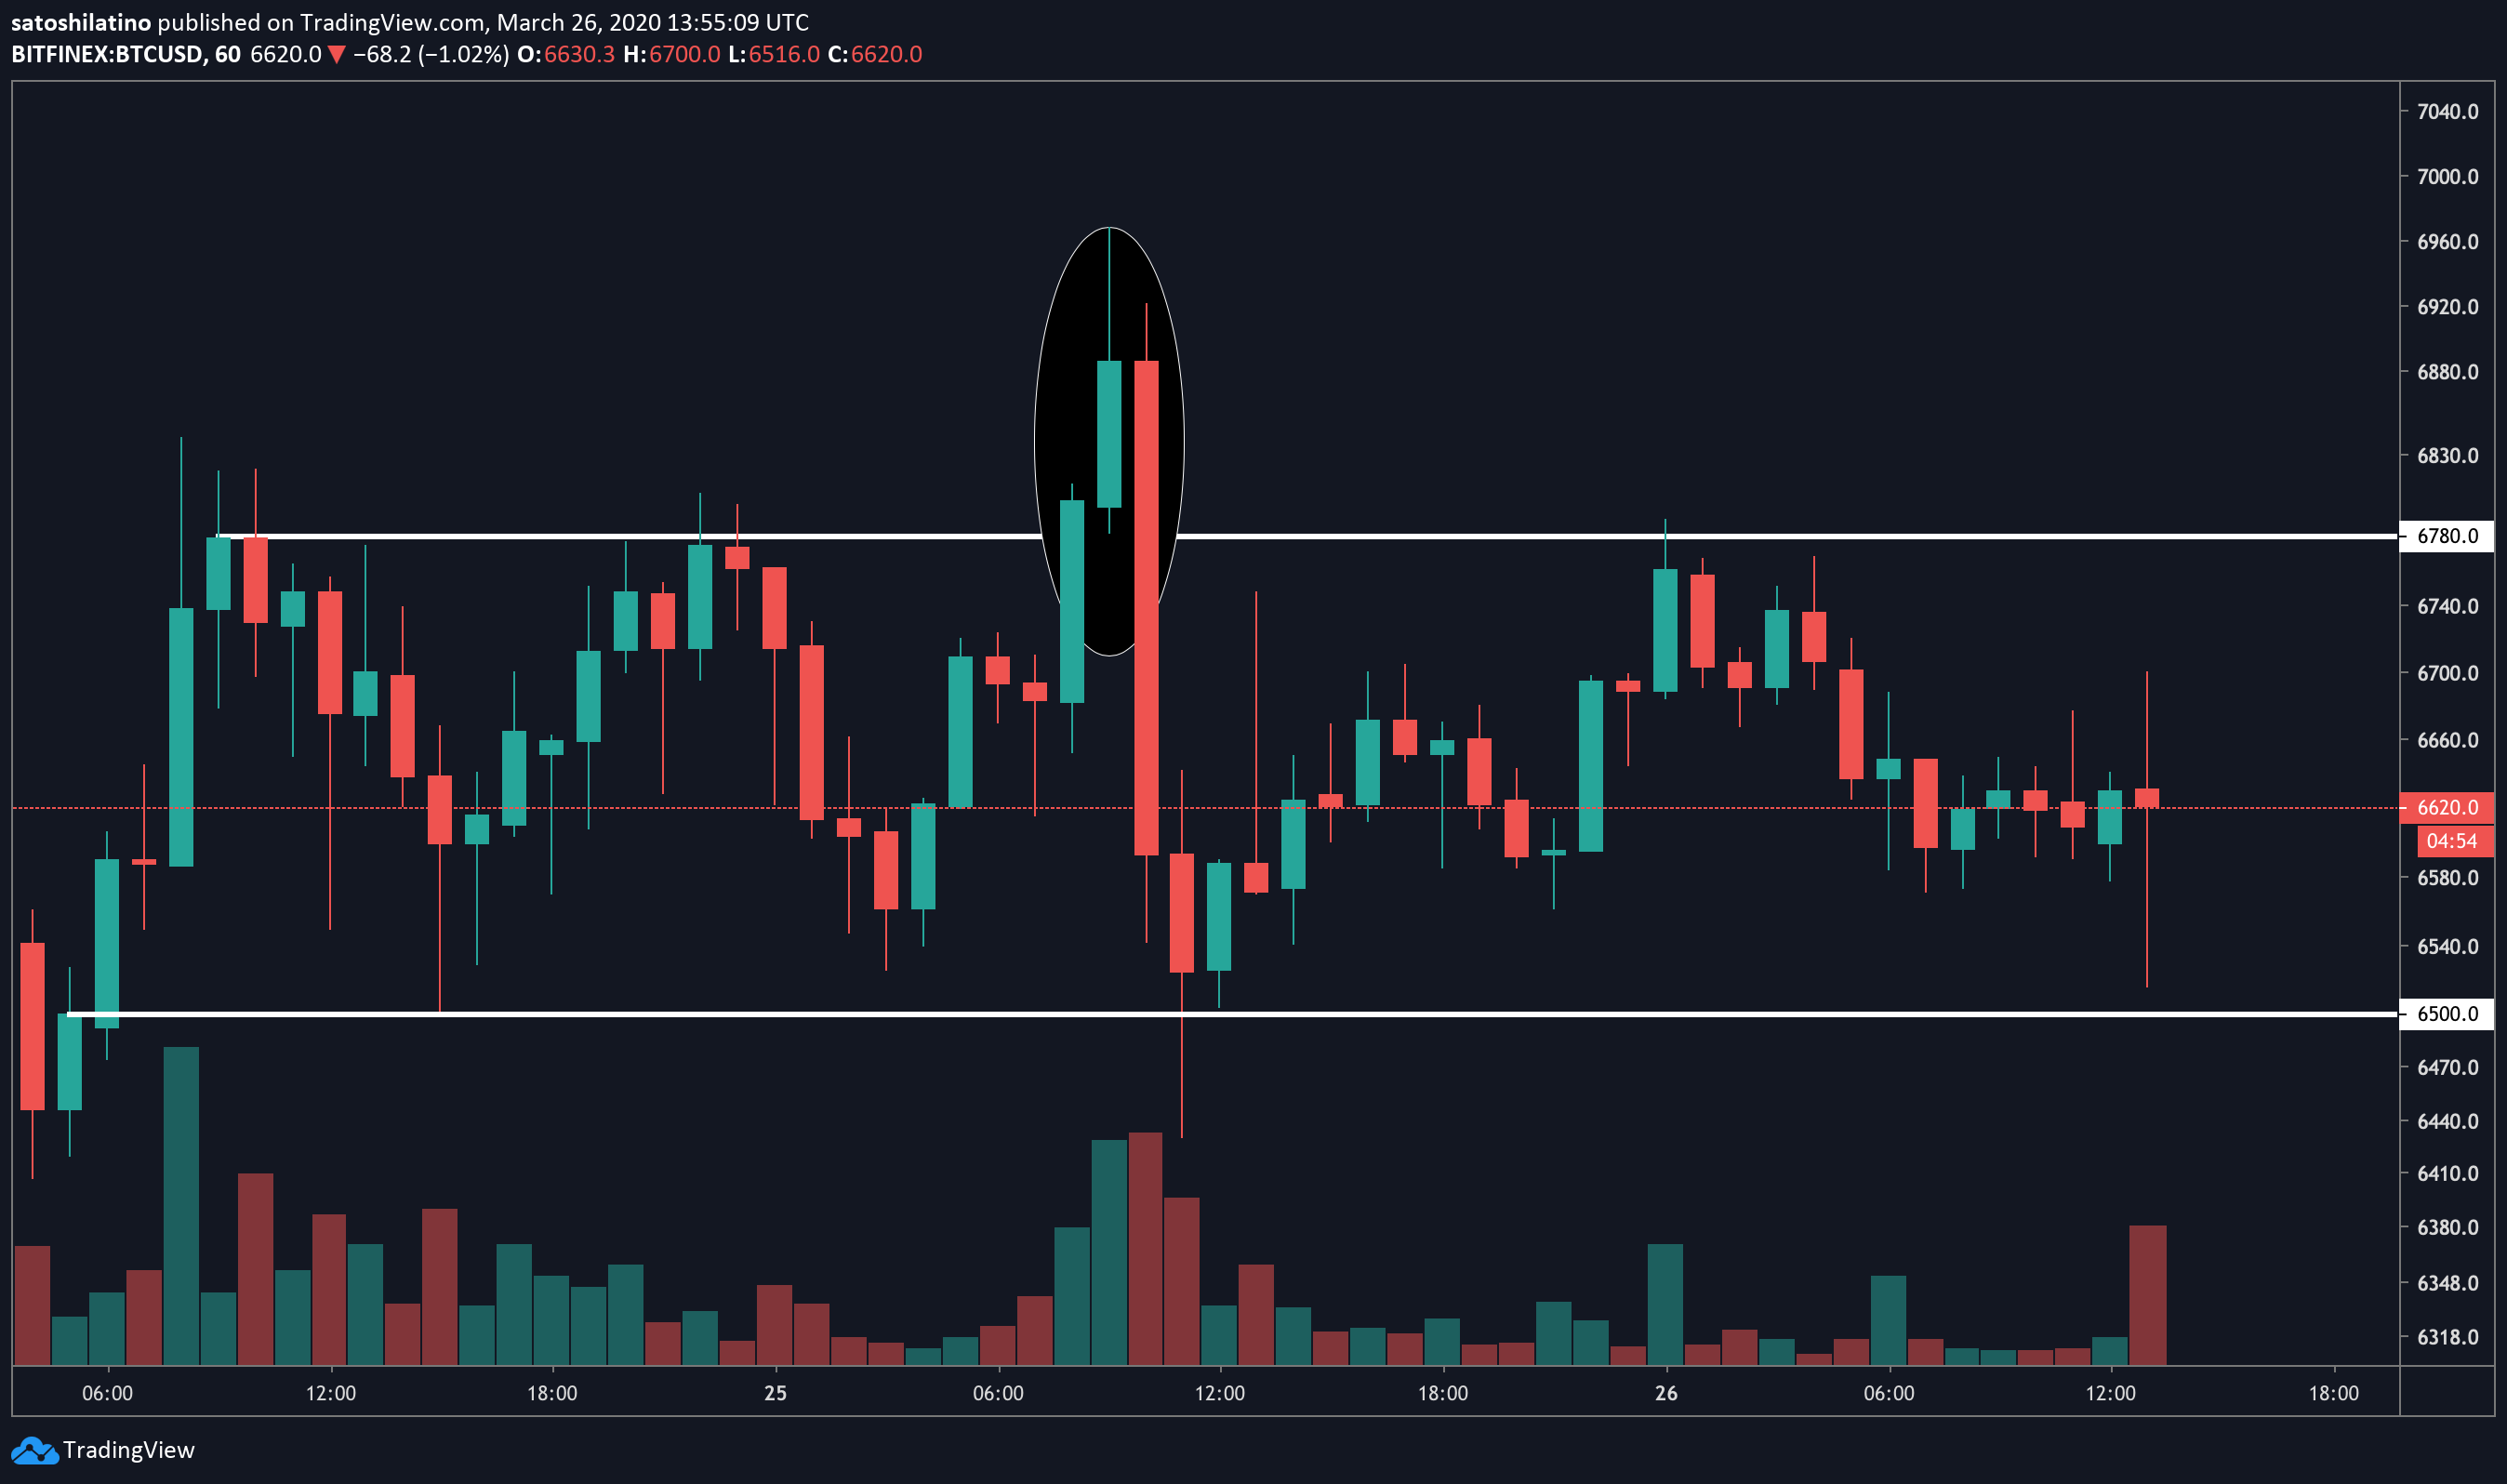
Over the past two days, Bitcoin has been mostly consolidating within a narrow trading range that is defined by the $6,500 support level and the $6,780 resistance level. Each time the flagship cryptocurrency surges to hit resistance, it retraces to support, and from this point, it bounces back again.
Although Bitcoin tried to break out of this $270 range yesterday, it got heavily rejected by the $7,000 resistance level.
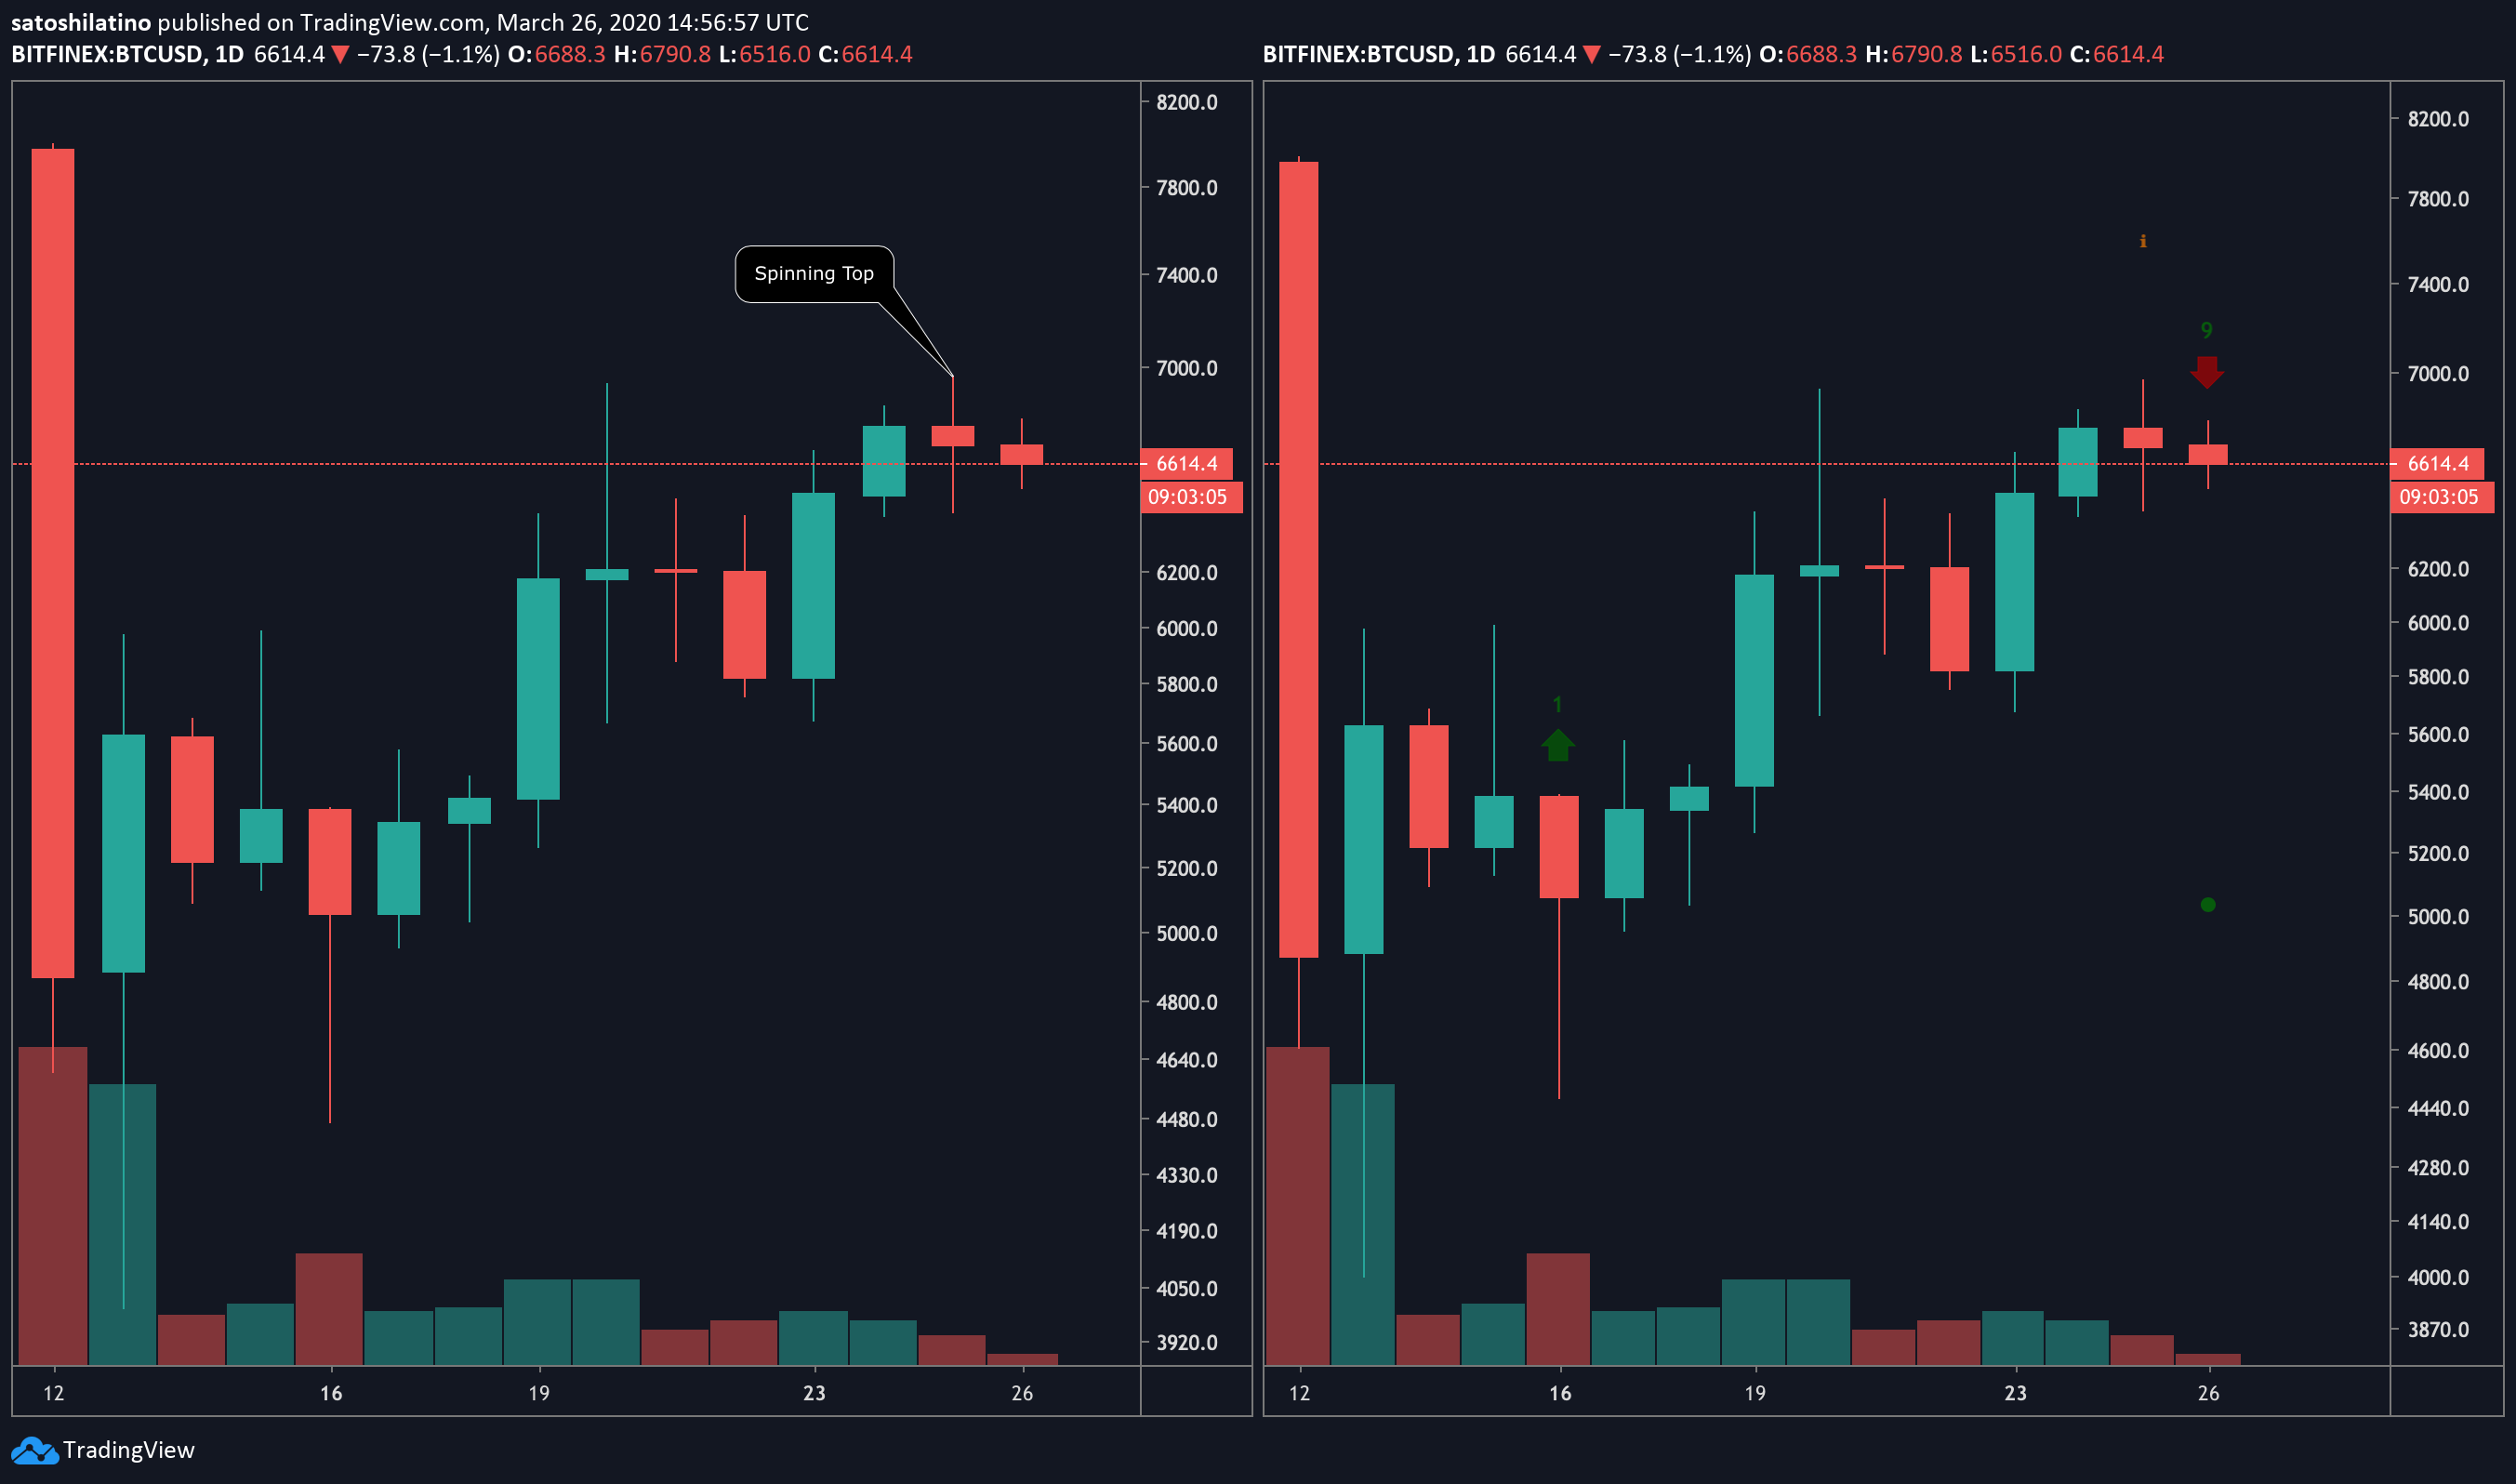
Data from on-chain metrics provider IntoTheBlock shows that there are over 340,000 addresses holding 236,000 BTC around $7,000. This important supply barrier was significant enough to prevent the pioneer cryptocurrency from advancing further, which resulted in a move back to $6,500.
 In/Out of the Money Around Current Price by IntoTheBlock
Despite the low levels of volatility seen in the past few days, Bitcoin’s price action could be about to go erratic. Skew, a crypto derivatives data analytics firm, recently stated that March 27 will see the expiry of 49,400 BTC worth of outstanding derivative contracts. This is equivalent to $328 million in Bitcoin options open interest.
The upcoming quarterly expiry will be “very important” to watch since Bitcoin tends to experience high volatility during these events, according to Su Zhu, CEO at Three Arrows Capital. Zhu explained that last year the market bounced quite aggressively from backwardation to contango after the expiry. Now, a similar scenario could take place.
Bitcoin’s Volatility May Rise
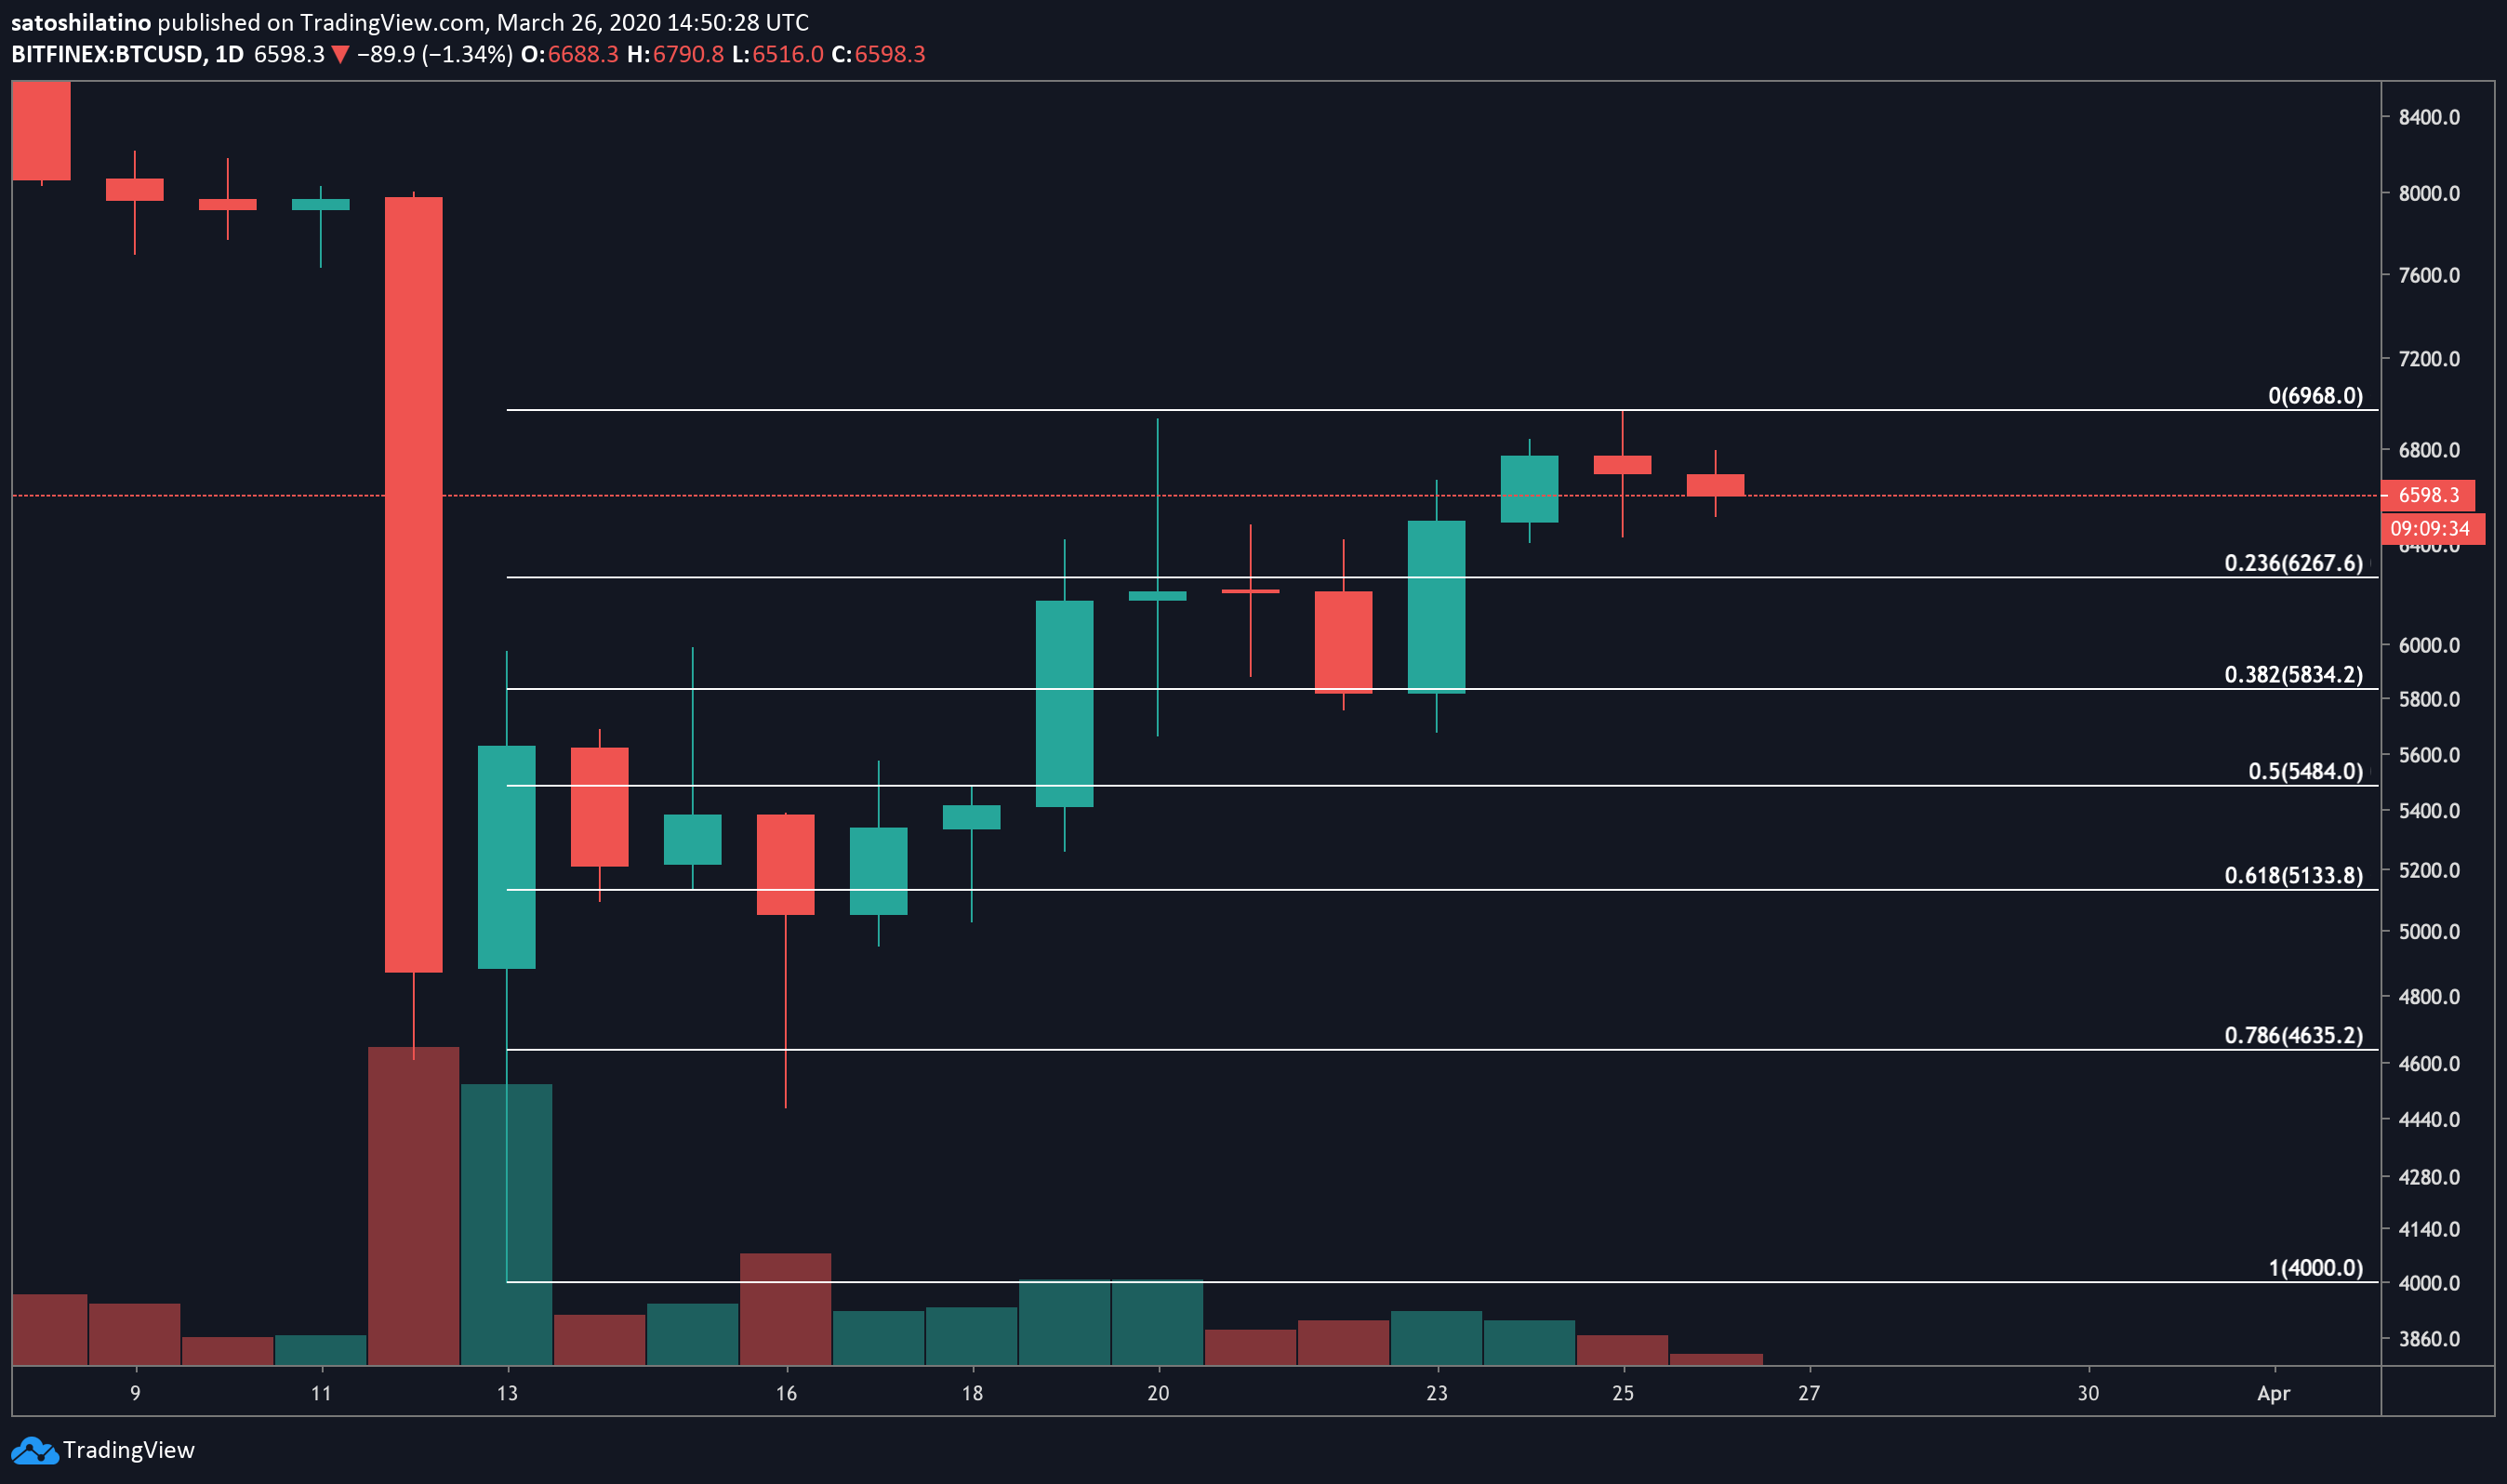
Based on BTC’s 1-day chart, a spinning top candlestick pattern appears to have developed. This technical pattern usually forms when there is indecision about the trend of a given asset. Spinning tops indicate that neither the bulls nor the bears were able to gain control of the price action.
Nevertheless, the current candlestick is a green nine candle, according to the TD sequential indicator. This type of candlestick pattern is considered a sell signal, which could be followed by a one to four candlesticks correction before the continuation of the uptrend.
When a spinning top candlestick and a green nine candlestick develop one after the other, like in this case, the odds for a retracement increase substantially.
The Fibonacci retracement indicator estimates that a spike in the selling pressure behind Bitcoin around the current price levels could see it fall to $6,300 or $5,800. These areas of support are where the 23.6% and 38.2% Fibonacci retracement levels sit, respectively.
Davinci Jeremie, also known as a Bitcoin guru for his price predictions, believes that such a retracement is very likely to happen and would make it ideal for the flagship cryptocurrency to move towards $8,500. The analyst maintains that the amount of incoming fiscal and monetary stimulus will push Bitcoin to higher highs.
“This money printing that they are going to hand out to everybody, once it passes, I think Bitcoin would have to move higher. The reason why is because the market is a forward discounting mechanism, meaning that they are not going to allow the people who get these checks to buy Bitcoin at $6,000. It is just not going to happen. So, it is going to move the price higher so that those people can buy at a higher price,” said Davinci.
Time will tell whether history will repeat itself and Bitcoin indeed corrects before it surges to higher highs.