Choppy price action and indecisiveness – this is how we can summarize the past couple of days on the cryptocurrency market.
In our last BTC price analysis, we examined if whether or not $69K was the cycle’s top following the vicious corrections, and now, we take a closer look into how the market is developing from a technical and on-chain perspective.
Options Market Analysis
This Friday, December 10, about $946 million worth of bitcoin options contracts will expire in Deribit. Max pain price for this expiry is 53k. The puts at $50k strike price have the highest open interest with 1305 contracts.

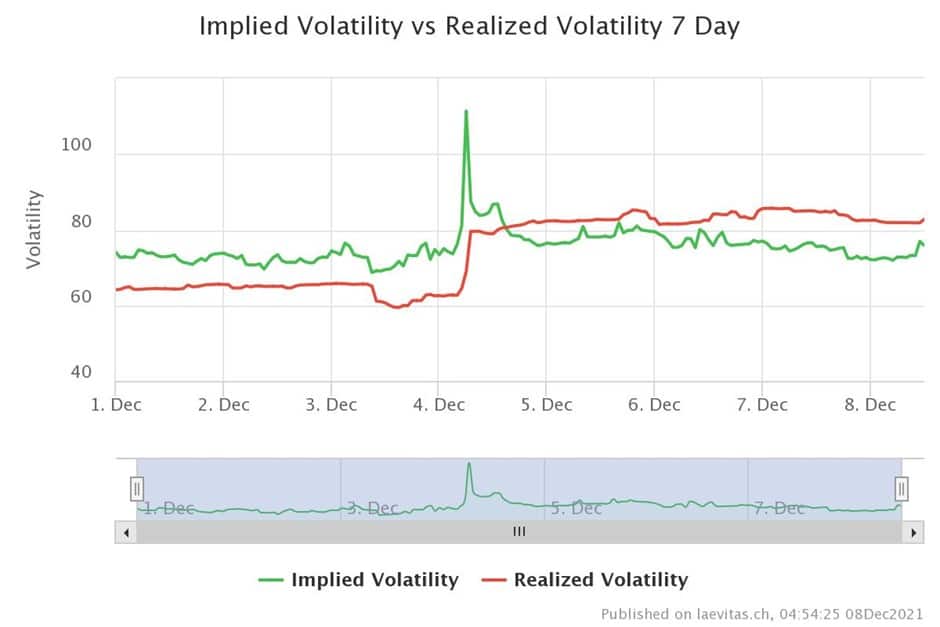
Realized volatility is still higher than implied volatility (IV). All in all, it seems that options traders are not sure about an imminent V-shape recovery yet.
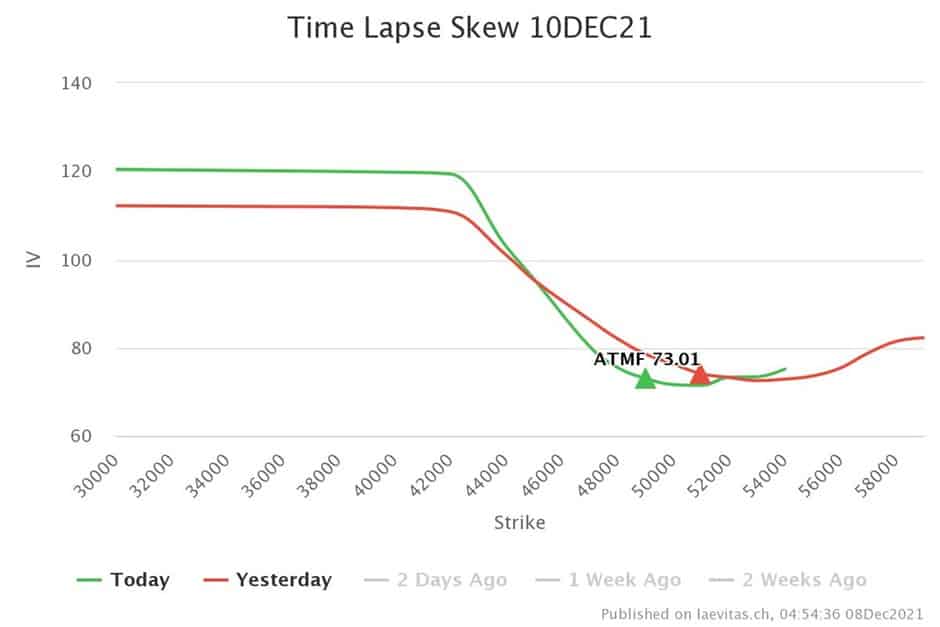
Time-lapse skew shows a higher IV for strikes below $45k. The simple interpretation would be that the options traders want to hedge against the market downside.
Futures Market Sentiment and Supply/Demand Analysis
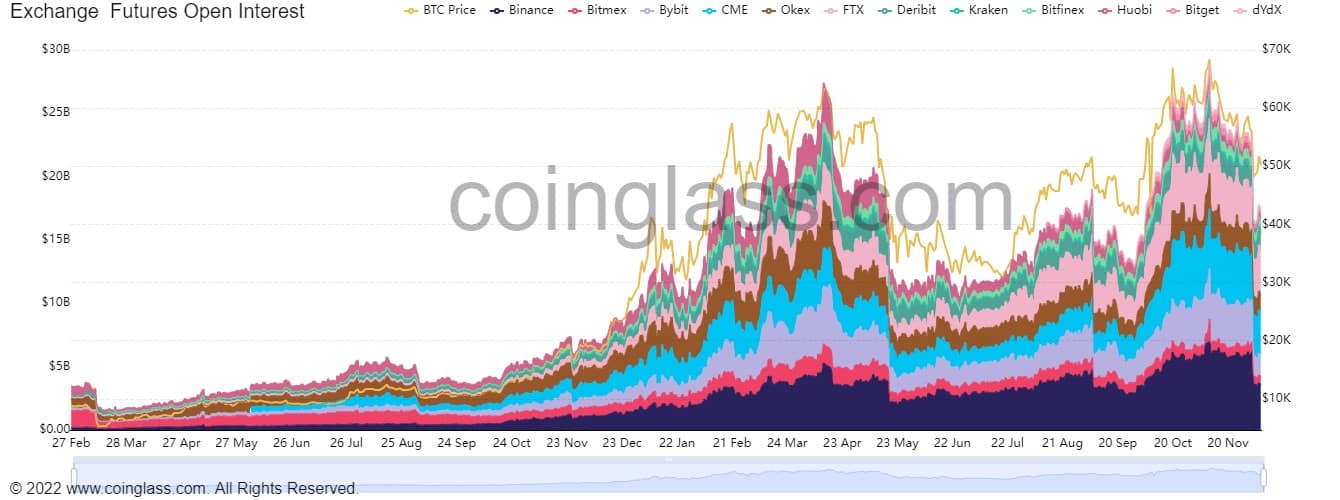
Like the market crash in May, last week’s market has experienced a massive drop in Futures Market open interest due to cascades of long liquidations. The open interest has dropped from its all-time high ($28.8B) to $17.2 B.
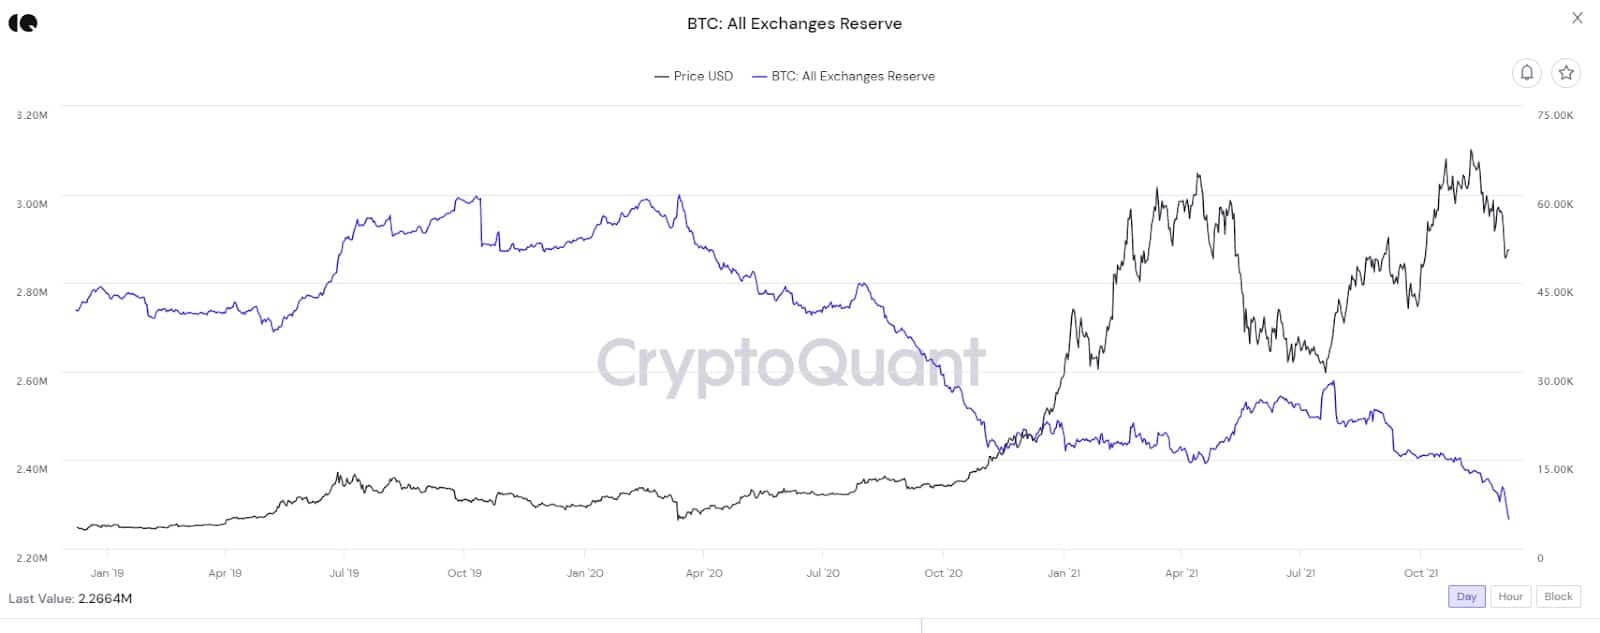
Interestingly, as the futures market was adsorbing the hit by a massive decline in open interest, the All Exchanges Reserves showed significant outflows from exchanges. This is entirely different from May’s last major market crash, where we have substantial inflows to the exchanges.
Technical Analysis
Current Market Conditions Choppy
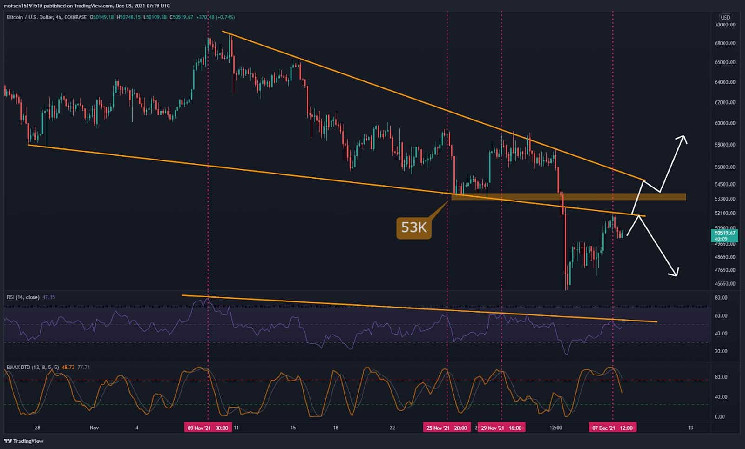
Yesterday, the price moved up on the 4H time frame following a sharp fall on December 6th and is currently struggling with its failed support. The RSI indicator is below 50 and follows a downtrend line since the price was 69K (new ATH).
Shifting from this bearish trend back to bullish momentum in RSI depends on retaking the mentioned failed support line. The BMAX DT indicator, which maps the momentum-change opportunities, is still decreasing and has not shown a positive signal.
We will have to wait for the required confirmations to ensure that the trend is reversed. Most of the technical analysis believe that going back to the 53K and stabilizing above that level would be a good signal.
Where is the Key Level to a Possible Reversal Trend?
Th buy orders on the major support levels caused the price to increase yesterday. However, the more substantial selling pressure from the short-term traders seeking an opportunity to exit the market drove it back to lower levels.
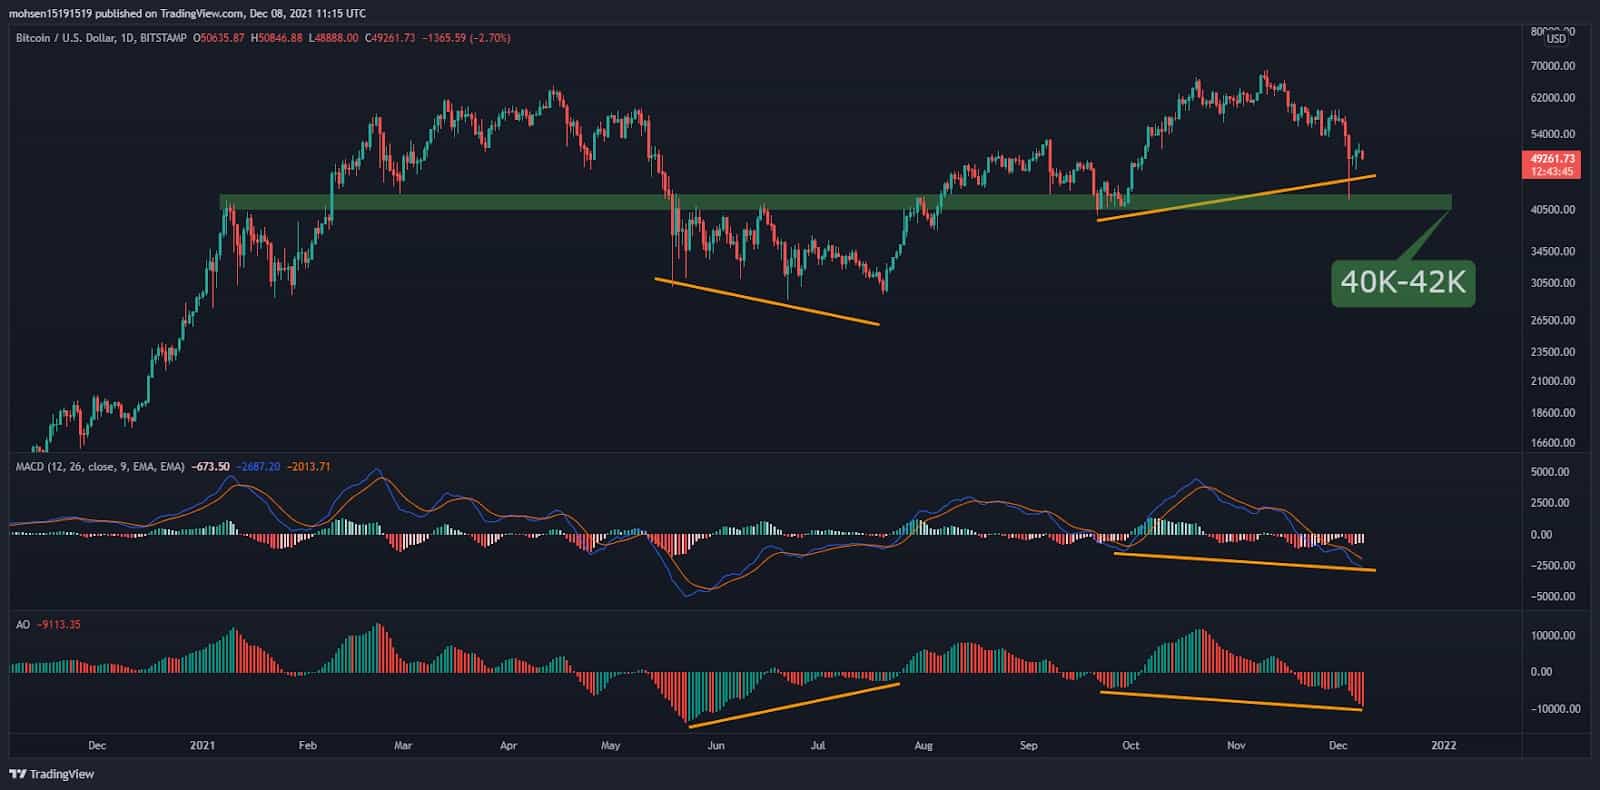
Due to the divergences that have formed in MACD and the awesome oscillator(AO), it’s important to remain vigilant of potentially lower prices on the daily timeframe. At the moment, the critical support level is $42k-$40k. Don’t forget that the market is fearful about the new COVID variant and possible lockdowns.
The above analysis was complied by @N__E__D__A, @GrizzlyBTClover, and @CryptoVizArt. Data provided by @tsypruyan exclusively for CryptoPotato.