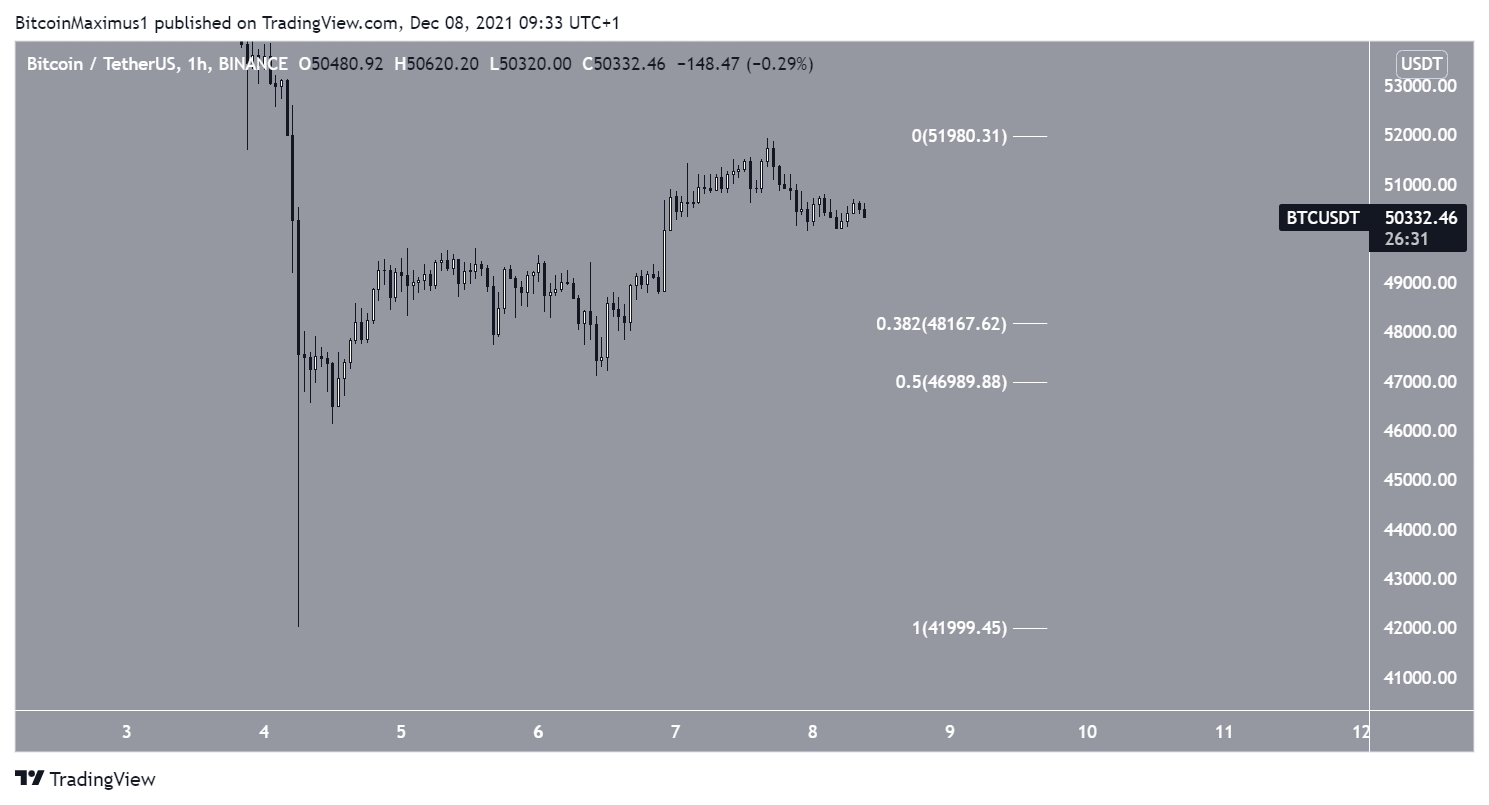
Bitcoin (BTC) was rejected on Dec 7 and failed to reclaim the line which previously acted as support. There is short-term horizontal support between $47,000-$48,150.
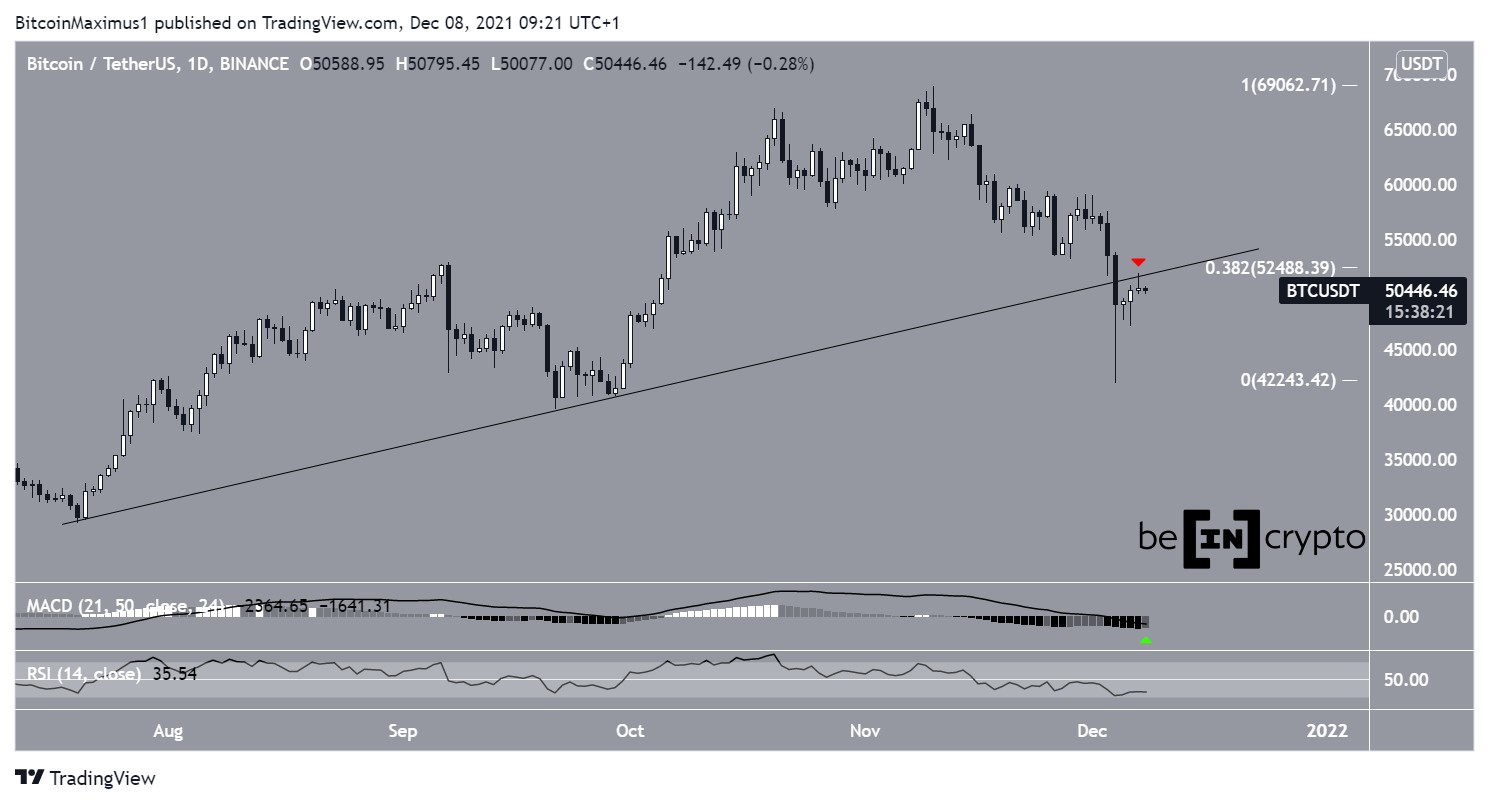
On Dec 7, bitcoin reached a high of $51,936 before falling. The high served to validate the previous ascending support line (red icon) as resistance. Furthermore, the line coincides with the $52,500 resistance area, created by the 0.382 Fib retracement resistance level, increasing its significance.
BTC was rejected at this level and has been falling since then. Technical indicators provide a bearish outlook.
The MACD, which is created by short and long-term moving averages (MA), is negative and falling. This is a sign that the short-term MA is slower than the long-term average. It has begun to create a higher momentum bar, but that could be invalidated before the daily close.
The RSI, a momentum indicator, is below 50 and decreasing. This is also a sign of a bearish trend.
Therefore, the daily chart provides a bearish outlook.
Current channel
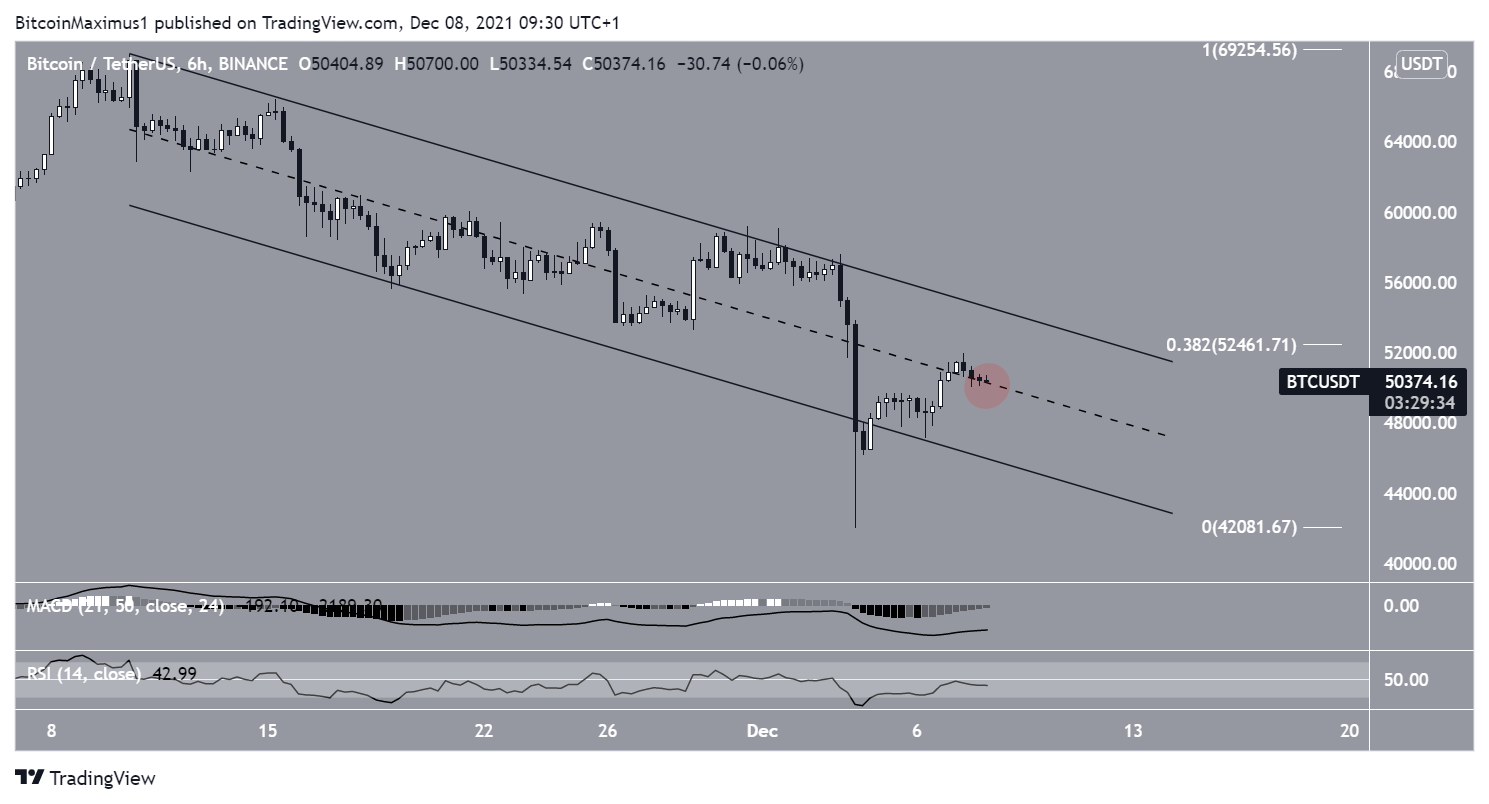
The six-hour chart shows that BTC is trading inside a descending parallel channel since Nov 10, after it reached an all-time high price of $69,000.
Currently, BTC is trying to reclaim the midline of the channel and validate it as support (red circle).
Both the MACD and RSI are moving upwards, even though the former is not yet positive and the latter is below 50.
More importantly, the resistance line of the channel coincides with the previously outlined $52,500 resistance area.
Therefore, until BTC manages to break out above this level, the correction cannot be considered complete.
Short-term BTC movement
If the rejection continues, there is short-term support between $47,000-$48,150. This is a horizontal support zone created by the 0.382-0.5 Fib retracement support levels.
Therefore, it would be suitable for BTC to create a higher low and rebound to the upside.