- Bitcoin price analysis is bearish today.
- BTC has fallen below the psychological mark of $50k.
- Bitcoin continues to look for support.
The Bitcoin price analysis report reveals a dramatic bearish situation as the Bitcoin fell below the $50,000 range today, and a sudden drift towards the $47,000 range has been observed as well. This looks like the strongest correction after May 2021, when Bitcoin closed below the EMA100, as the bearish pressure is immense and something the same can happen again. Speculations for BTC to go as low as $48,000, even down to 45,000 were already in the market, and the bearish indications for the past few days were already confirming them. But speculations are speculations, and rumors are rumors. What happened today was expected, but it came as a surprise to many in such a sudden plunge.
BTC/USD 1-day price chart: BTC looks for support
The 1-day price chart for Bitcoin price analysis shows a steep decrease in the coin’s value as it came down from $53,725 all the way down to $47380 today in just a few hours, losing more than $6000 in price value. A swing low towards $42,000 was also observed. The BTC/USD yet have to clench on to a support, as all previous support zones have fallen one by one. BTC has lost 16 percent value over the last 24 hours and around 12 percent over the past week. On the other hand, the trading volume has increased by 69 percent over the last day but the market cap suffered by 16.42 percent.
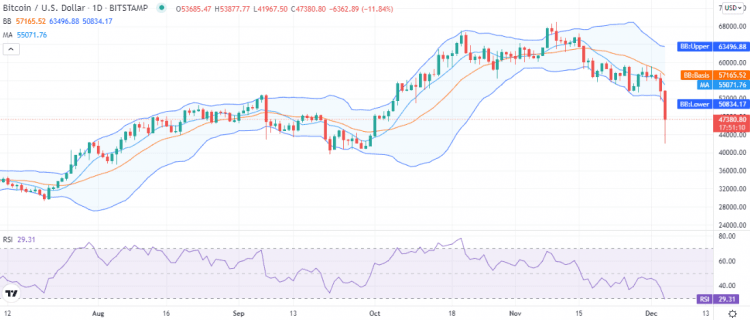
The volatility indicator shows comparatively high volatility, but BTC price has stepped far below the lower limit of the Bollinger bands. The lower limit at $50,834 represented support for BTC, which just fell and turned into a resistance zone now. The moving average (MA) is present at the $55071 mark.
The relative strength index (RSI) was already on a downwards slope giving bearish indications, but today it dived straight down and has just dipped into the oversold region, which is a strong bearish territory. As the RSI just touched index 29, the BTC has turned undervalued, so a little reversal in price function can be expected in the coming hours.
Bitcoin price analysis: Recent developments and further technical indications
The 4-hour price chart for Bitcoin price analysis shows the coin fell to $51,9668 during the first four hours today and then suddenly took a deep plunge towards $47,256. Bitcoin hasn’t found support yet as it continues to decline.
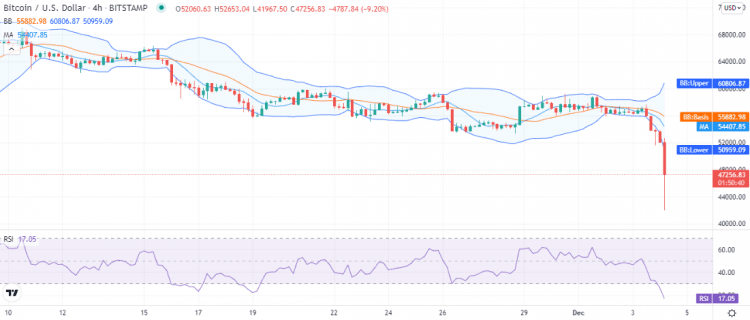
The volatility indicator started to diverge yesterday and took on to more steeper divergence today as the bearish pressure exceeded the expectation, and the price started falling tremendously, BTC price is trading below the lower limit of the Bollinger bands, and the moving average has also traveled low and is present at the $54,407 level. The RSI shows a critical situation as it has stooped low in the oversold region and is present at index 17, indicating high undervaluation at the moment.
Bitcoin price analysis: Conclusion
Bitcoin was first speculated to bounce of around $50,000 range, but that did not happen, then the second was 44,000 speculation for a bounce upwards, which seems correct at the moment, but as the coin hasn’t got the support yet, nothing can be said with confirmation, we can only assume for Bitcoin to float above $45,000 today.
Disclaimer. The information provided is not trading advice. Cryptopolitan.com holds no liability for any investments made based on the information provided on this page. We strongly recommend independent research and/or consultation with a qualified professional before making any investment decisions.