Bitcoin (BTC) has potentially reached a bottom and would confirm it with a breakout above its short-term resistance.
BTC decreased considerably during the week of Nov 22-28, leading to a low of $53,256 on Nov 28. However, a bounce began the same day and BTC closed the week just above $57,000. This led to the creation of a long lower wick, which is considered a sign of buying pressure.
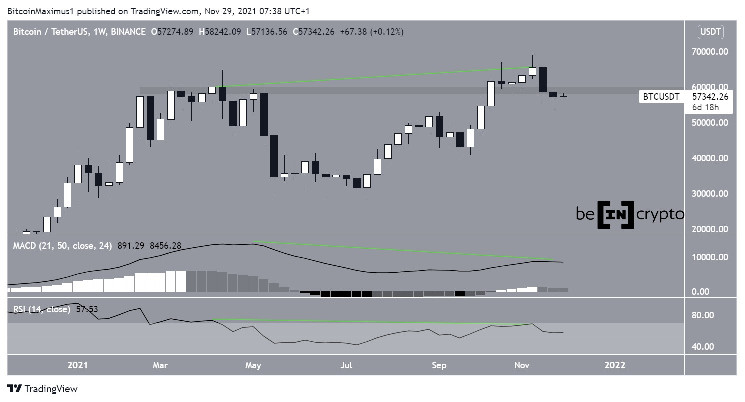
Despite the bounce, there are still considerable weaknesses developing in the weekly time frame.
Firstly, BTC has fallen below the $59,000 horizontal area. The area previously acted as the all-time high resistance between April-May and was expected to act as support.
Secondly, both the RSI and MACD have generated bearish divergences (green lines). This is a bearish development that often leads to trend reversals. The fact that it’s transpiring in a long-term time frame like the weekly is especially worrisome. However, the divergence is not very pronounced in the RSI, somewhat reducing its significance.
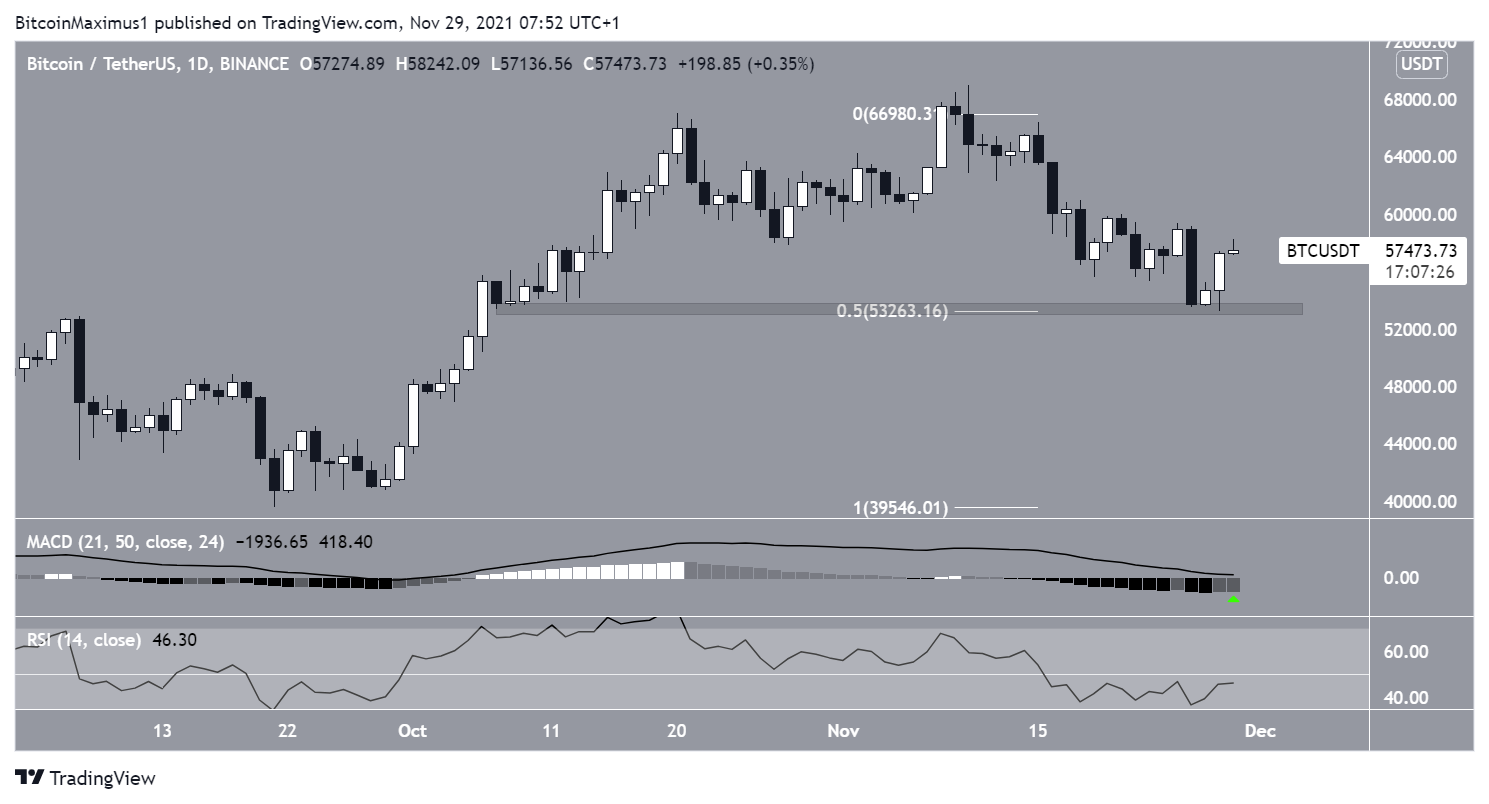
Daily BTC movement
The daily chart provides a more bullish outlook.
BTC has created a bullish candlestick after bouncing at the $53,250 support area. This is a horizontal support area and the 0.5 Fib retracement support level.
Furthermore, technical indicators are showing signs of a reversal.
The MACD, which is created by short and long-term moving averages (MA), is in the process of creating successive higher momentum bars. This is a sign that the short-term trend is picking steam relative to the long-term average.
The RSI, which is a momentum indicator, is also close to moving above 50. The 50-line is often considered the threshold for a bullish/bearish trend.
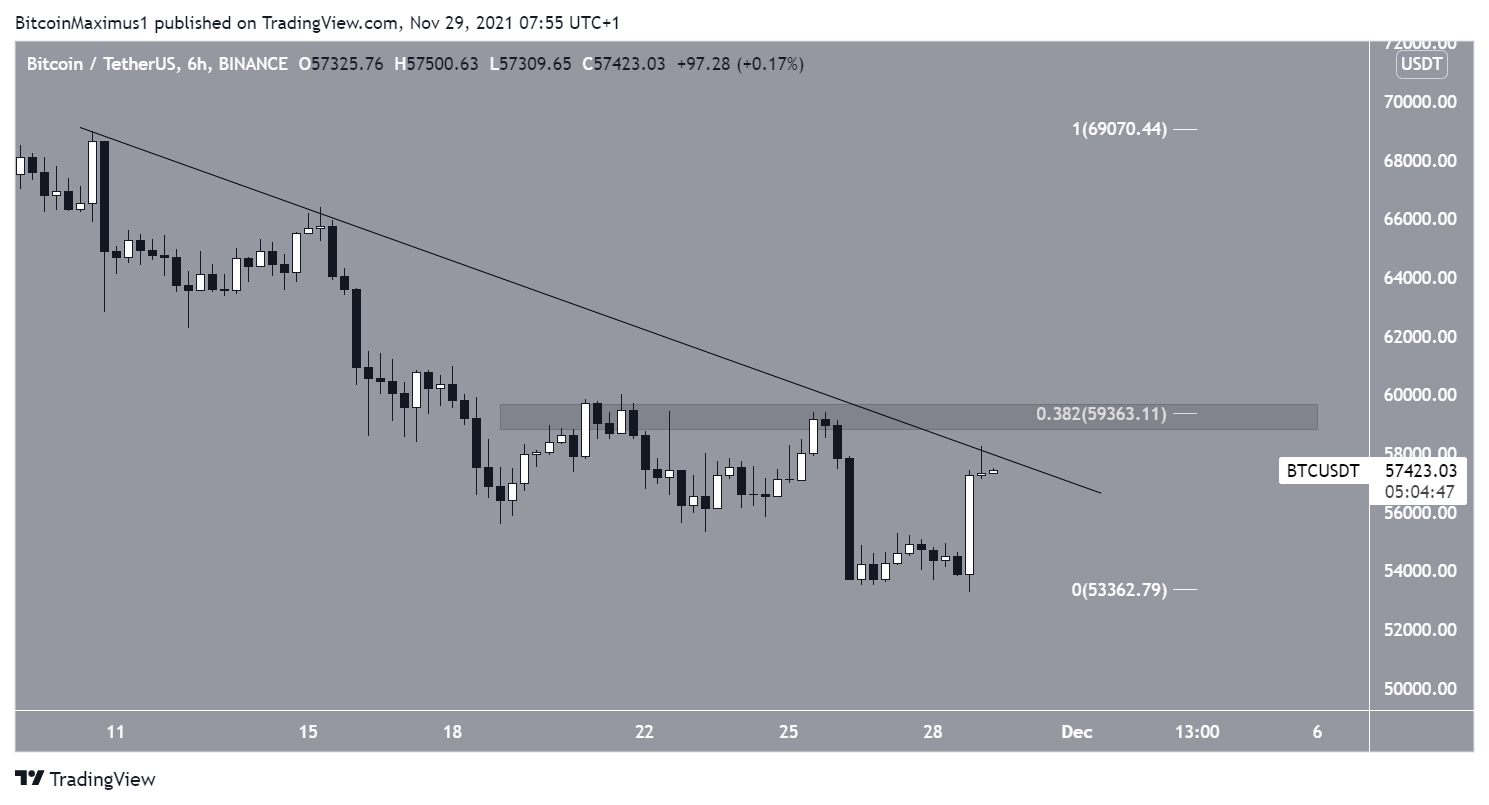
The six-hour chart shows that BTC is following a descending resistance line since reaching an all-time high price on Nov 10.
The line coincides with the $59,350 resistance area, which is the 0.382 Fib retracement resistance level.
A breakout above this line would cause the previously outlined indicators to confirm the reversal. Therefore, it would confirm that the correction is complete.