A closely followed strategist is eyeing price charts from the 2017 Bitcoin (BTC) bull run to see where the world’s leading crypto is heading next.
Justin Bennett tells his 82,800 Twitter followers that comparing BTC’s previous peaks and valleys is “like having a cheat code.” He foresees a new all-time high of $80,000 just around the corner, followed by a leap past $100,000.
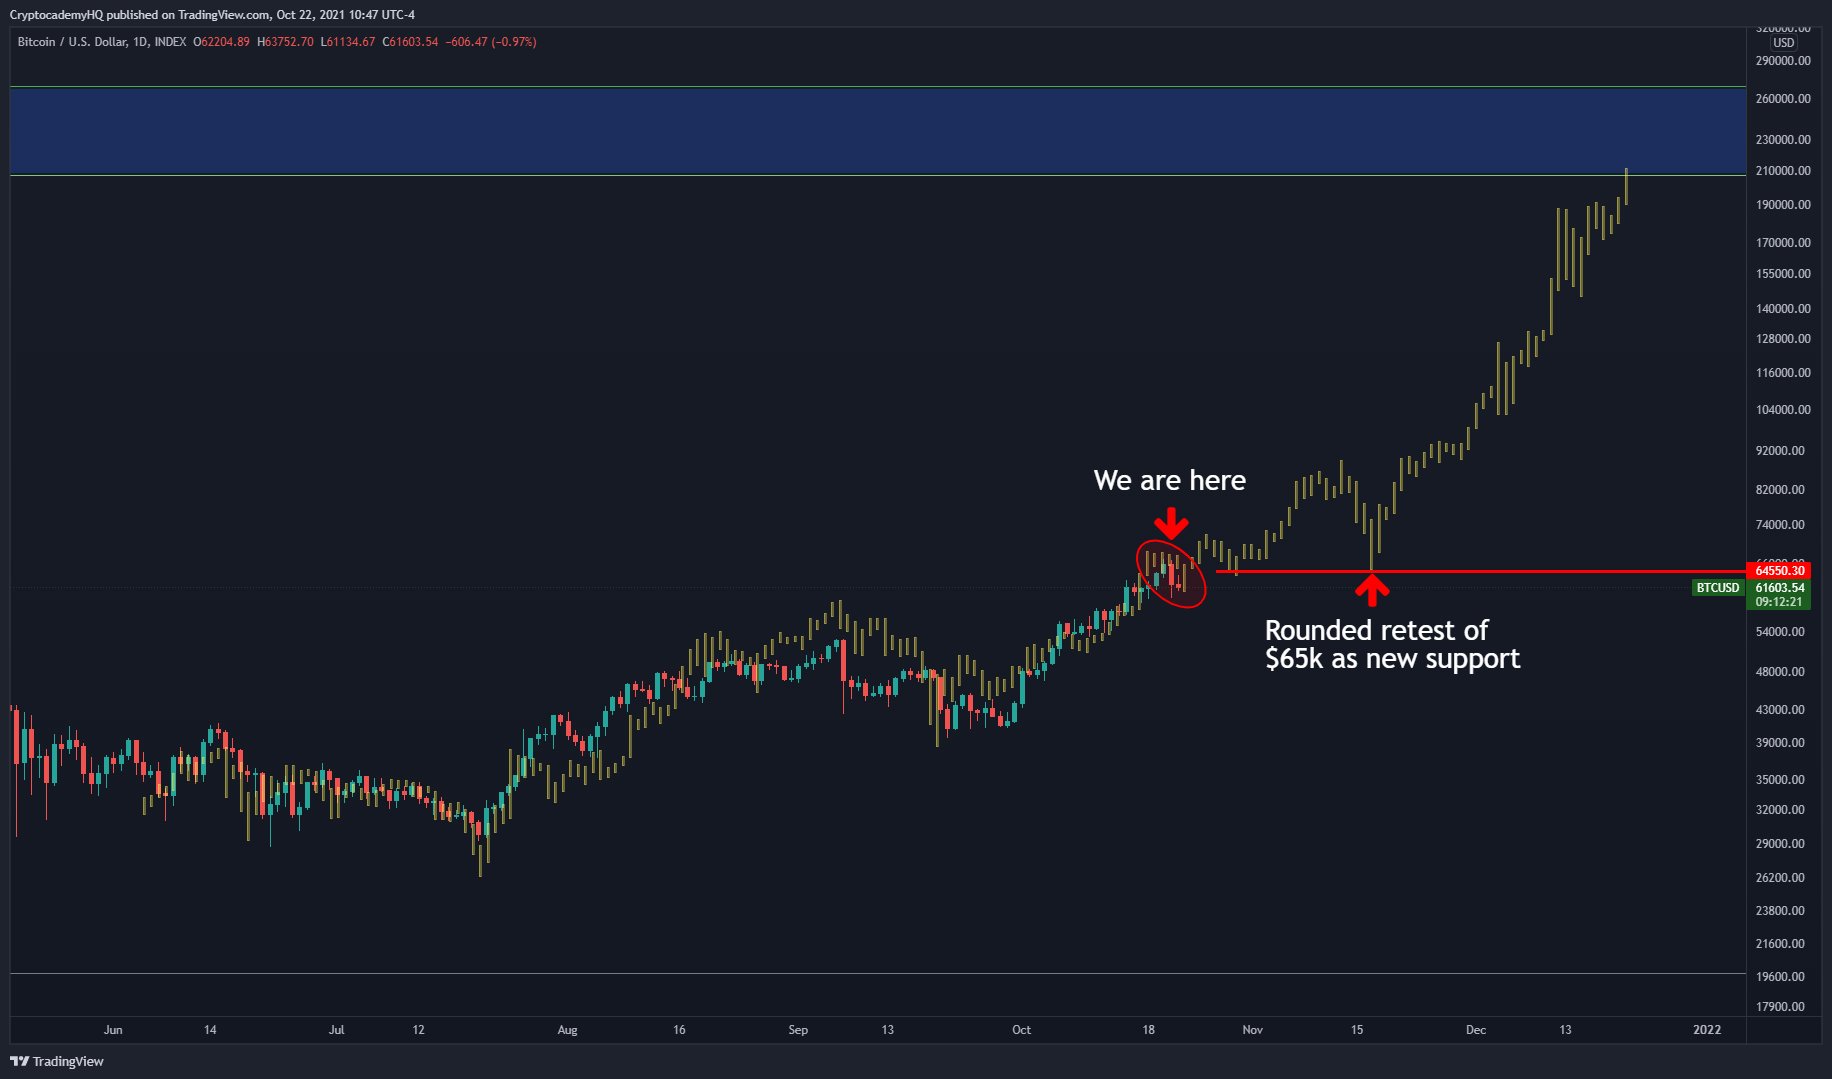
“The 2017 fractal accounts for this week’s pullback.
Each move this cycle has been a little less aggressive than in 2017.
It was a 13% pullback then. Probably an 8-10% pullback now, or $60k BTC.
Then $80k+ in early November, $65k retest in mid-November, and $100k+ in December.”
The trader uses some video game jargon in a follow-up tweet.
“This is like having a cheat code
As long as it doesn’t deviate.”
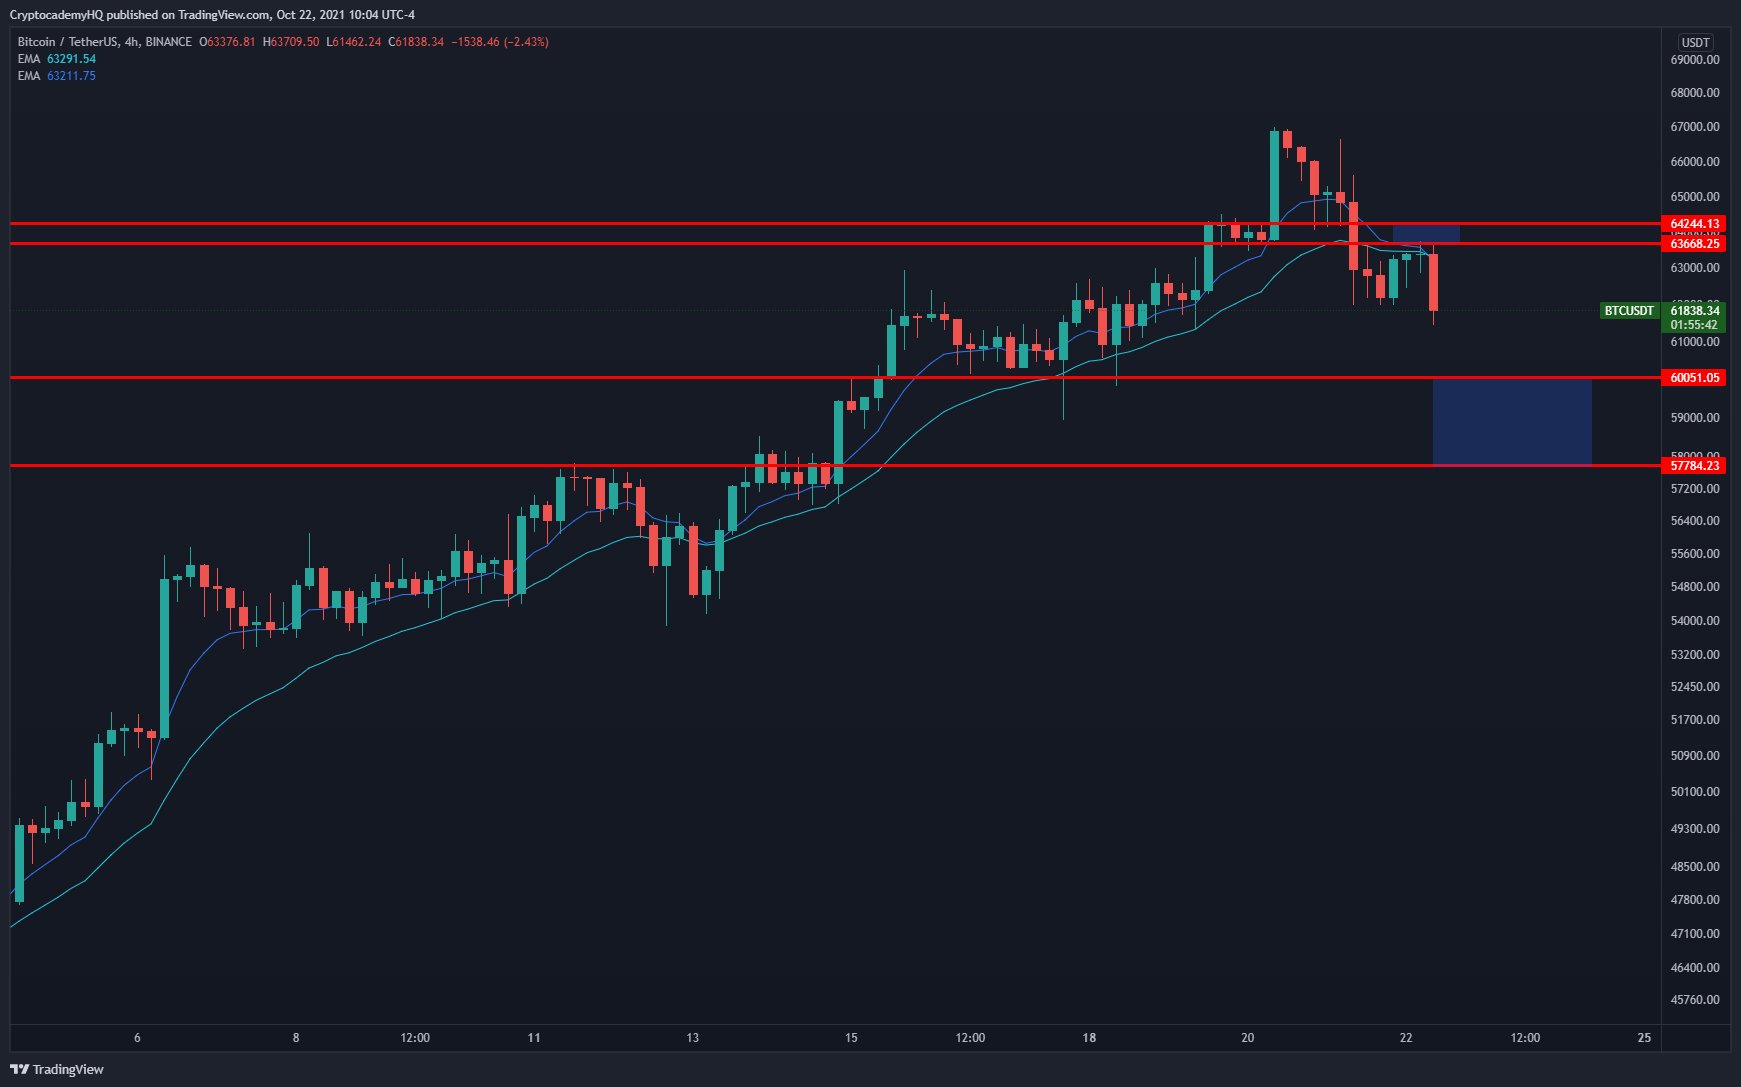
Bennett next zooms in on the BTC candles chart as he highlights a pullback that mirrors a 2017 price drop.
“Here’s that slight BTC pullback I was referring to yesterday.
Next area of support is $58,000 – $60,000.
Bitcoin needs to reclaim the $64,000 area to become constructive again.”
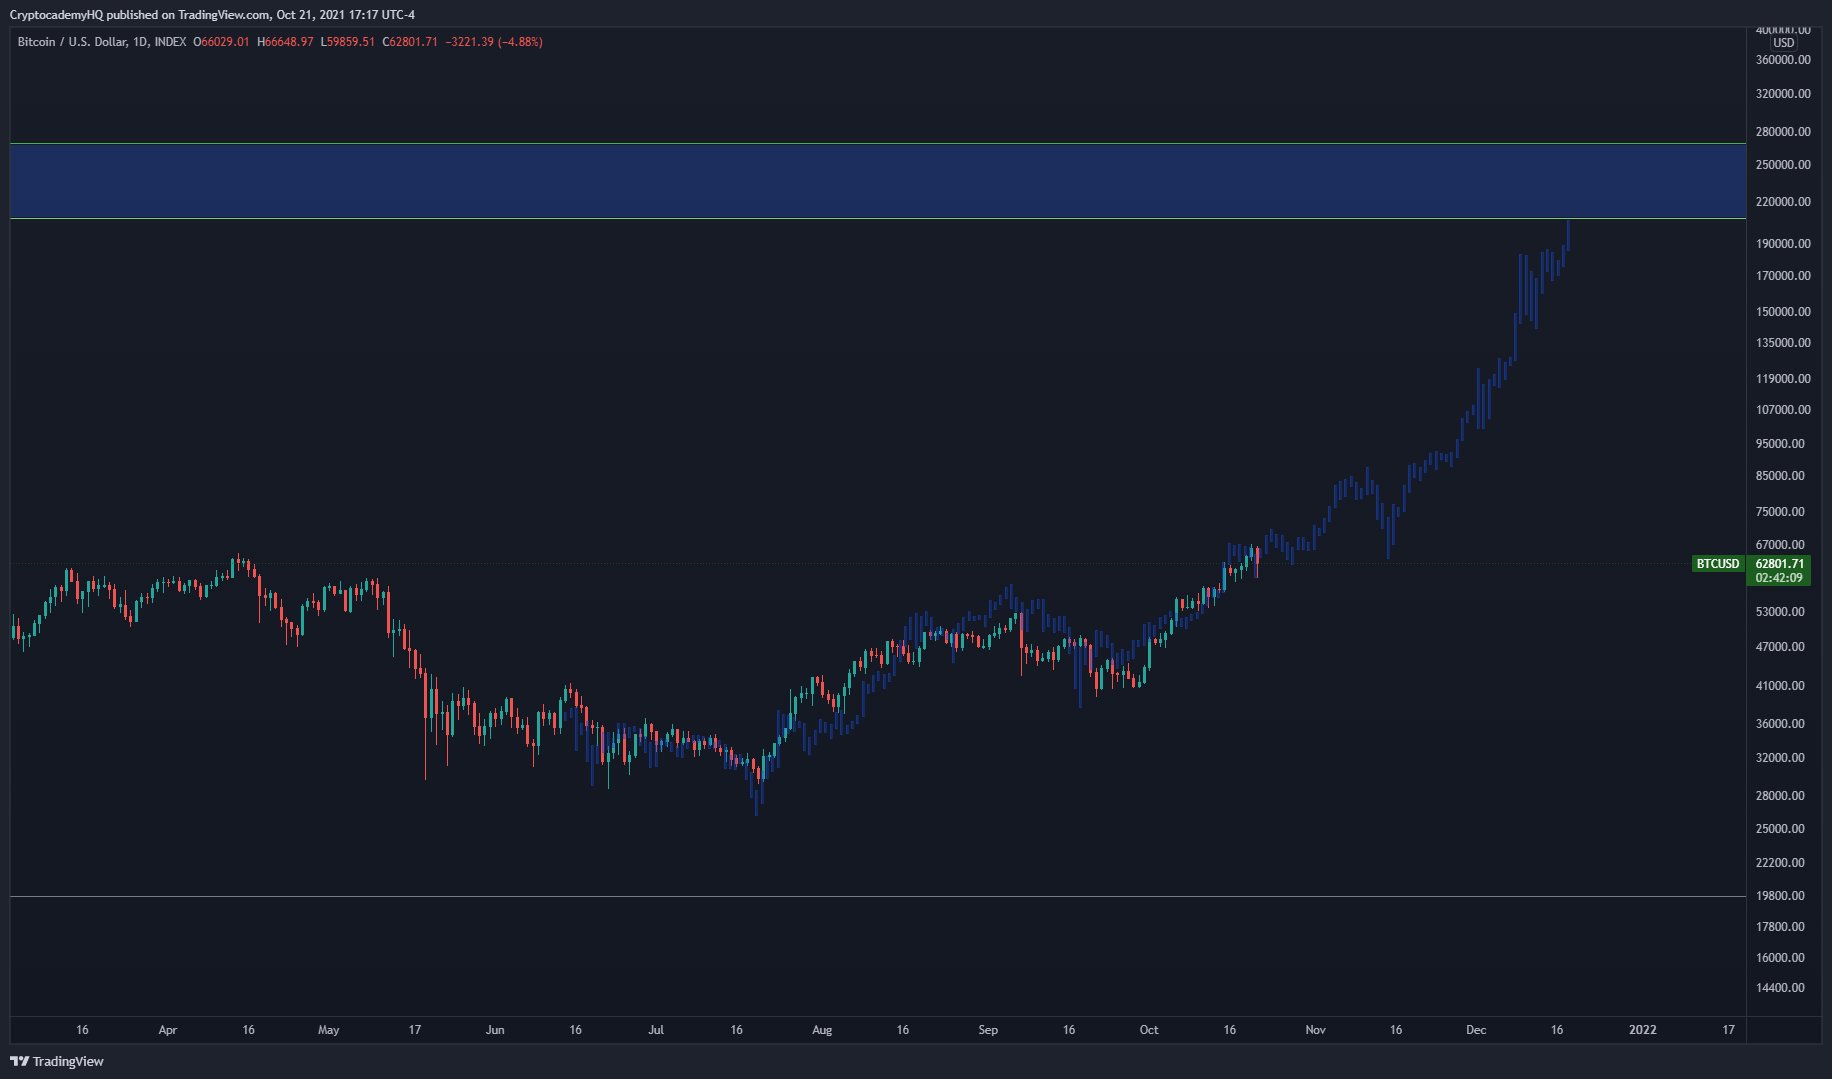
Finally, the analyst plots out a price road map where Bitcoin surges well past $100,000 into the $200,000+ range by early January of next year.
“I think something like this is much more likely.”