Bitcoin’s price has been struggling to recover from September’s fall but the market has been very restrictive. The price of the largest cryptocurrency stood at $8,056.58 at press time with a market cap of $145.51 billion and noting only minimal growth of 0.42% within the past day. However, long-term charts indicated strong presence of bearish sentiment in the Bitcoin market.
6-hour
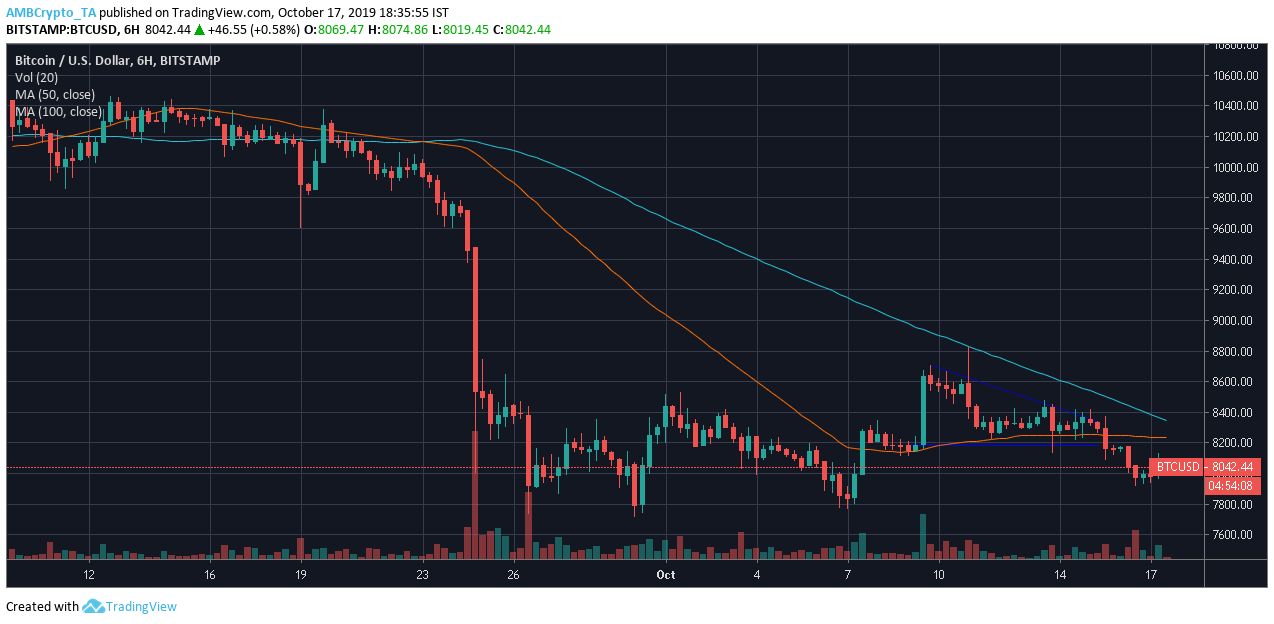
Source: BTC/USD on TradingView
The longer-term chart of Bitcoin showed the breach of the descending triangle. The triangle formed marked lower highs at $8,706.70, $8,440.99, and $8,333.44, and a horizontal trend line marked the support at $8,185.85. The consolidating price breached the pattern and fell by 5.11%, from $8,339.02 to $7,912.66.
The bearishness in the market was also reflected by the moving averages as 50 moving average laid under 100 moving average. Both averages aligned above the candlesticks affirming trend. With the 100 moving average leading the charge, BTC lost 18.10% of its value in the past 24 days.
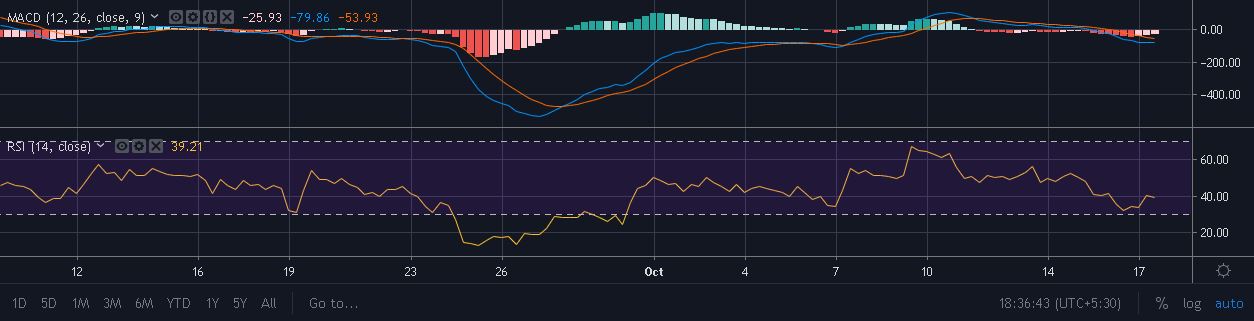
Source: BTC/USD on TradingView
MACD indicator suggested bearishness with MACD line under the singal line. Relative Strength Index appeared closer to the oversold zone, thus making it a bearish sign. An extended bearish trend is expected for Bitcoin even after the breach of the descending triangle pattern.