In my fourth trade journal, I am updating my previous Bitcoin (BTC) position as well as discussing the reasons that I have reentered a new long position on the same asset. I am also highlighting a quick loss on Ravencoin (RVN), which dropped alongside Bitcoin. As I often say, this loss is proof that you win some and you lose some. What matters is that you lose small.
BTC/USD
As mentioned previously, I took a swing position in Bitcoin on Sept. 26 at $7,914. I exited 50% of the trade at $8,625. After moving my stops well into profit and below support, I stopped out in profit with the remainder of the trade, at $8,390. This amounted to an 8.9% profit on the first half of the position and a 6% profit on the back half. As a whole, I bagged a 7.45% profit on the trade.
I reentered a new Bitcoin position on October 16th, at $7,940.
Setting up the trade
Entry: $7.940
Targets: $8,395, $8,949, $9,723
Stop Loss: I set the stop loss at $7,834 which is below the ascending channel support with a bit of breathing room to avoid a long wick or shake out.
Calculating the risk-reward ratio
It’s also good practice to consider the risk to reward ratio when making an investment, especially with altcoins given Bitcoin’s current dominance rate.
The risk to reward ratio measures the difference between a trade’s entry point all the way to the stop-loss and sell or take-profit order.
Risk/Reward: Target 1 = 4.38, Target 2 = 9.7 Target 3 = 17.16
Entry idea

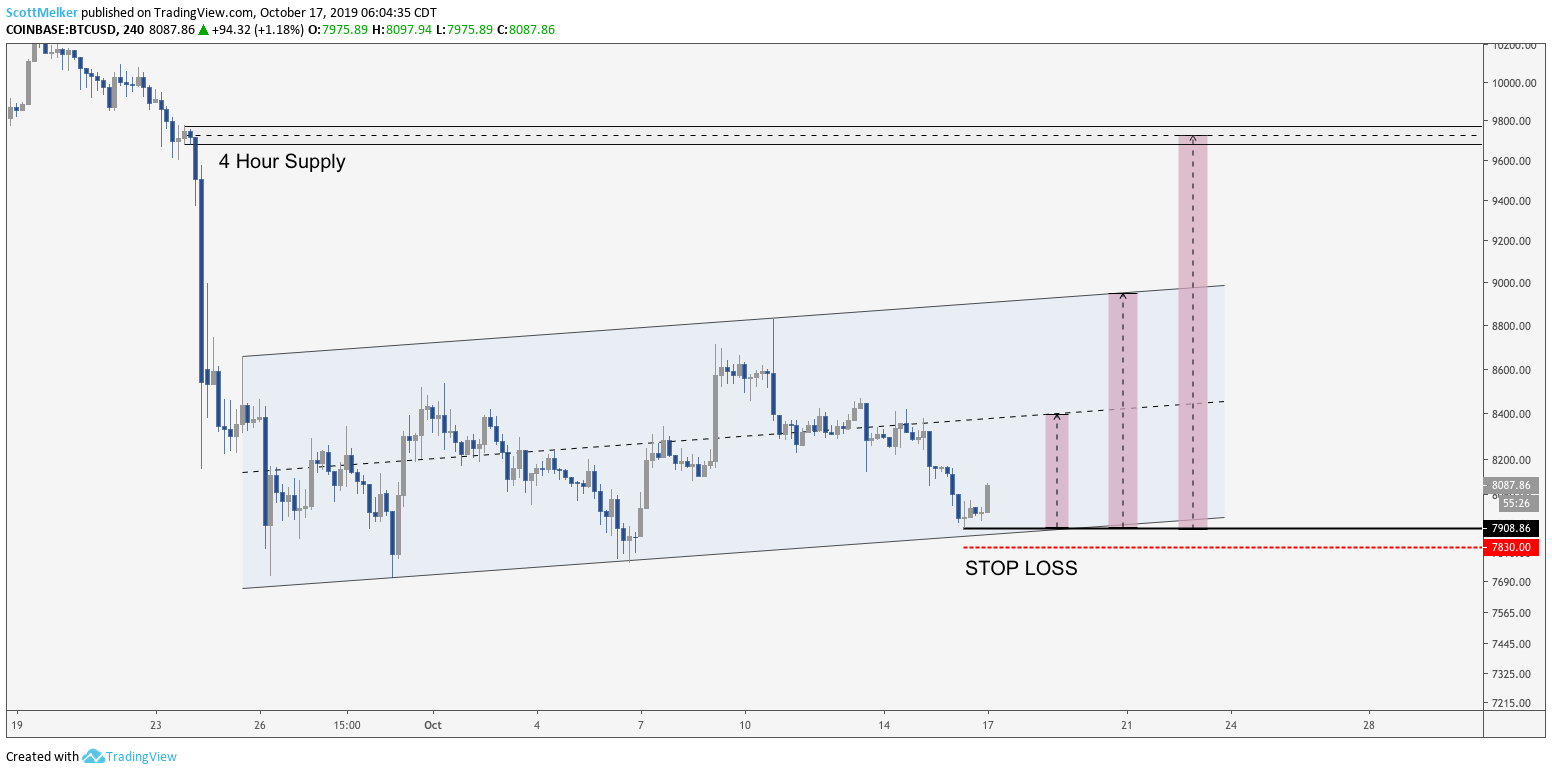
BTC USD 4-hour chart. Source: TradingView
The 4-hour chart shows a clear ascending channel at the base of the large drop from $10,000, commonly referred to as a bear flag. There is debate as to whether this qualifies, as the price has been traveling in this pattern for longer than would be expected from a classic flag. While ascending channels more often break down than up, the risk/reward for a long position near the channel bottom justified a position with a tight stop.
You read that correctly - I took a long position against the trend, even when the price was likely to continue down, which is something I often do when the potential reward is mathematically far greater than the small loss. Further, price reversals often begin as ascending channels, as there are few ways for the price to bottom out and then continue up.
I also like taking trades at the bottom of ascending channels, because it offers the opportunity for a tight stop that can be moved up with the ascension of the channel over time. Your stop loss naturally reached the point of entry if the trade remains valid.
I was watching the price action closely and identified a hidden bullish divergence with the Relative Strength Index (RSI) on the 4-hour chart. The price was near the bottom of the channel. As mentioned earlier, I prefer to set orders above the perfect entry or support, because trades are often front run when everyone is watching the same area.
Once the bullish divergence was confirmed and the price bounced a bit, I entered a long trade. The image above shows the ideal setups from the bottom of the potential reversal at $7,908. Fortunately, I managed to enter a bit higher.
I chose three potential targets, although I plan to exit the majority of the trade at the first target. The targets are the equilibrium of the ascending channel, the top of the channel, and the 4-hour supply zone from the beginning of the move down weeks ago.
Bitcoin price is currently at $8,087 and slowly moving towards the first target. The stop loss is illustrated in red on the chart below. My plan is to continuously update this trade as it develops and I intend to move up my stop loss as warranted.
BTC USD 4-hour chart. Source: TradingView
RVN/BTC
Entry: .00000415 satoshis (sats)
Targets: .00000518 (sats), .00000588 (sats), .00000892 (sats)
Stop loss: .00000408 (sats) for a potential loss of 1.68%.
Entry idea
Ravencoin (RVN) appeared to have bottomed out in a weekly demand zone that was formed around the all-time low at .00000266(sats). The price showed significant bullish divergence with the RSI on the daily chart in confluence with the touch on the top of weekly demand. This was a solid sign of a reversal, but not an area that I was interested in trading at the time. .00000415 (sats) was the first key resistance that I wanted to see flipped to support, so I was looking for an entry on the first retest of this area after the break. I took the trade on Oct. 15th, as the support test appeared to be confirmed.

RVN BTC weekly chart. Source: TradingView

RVN BTC 4-hour chart. Source: TradingView
Adding fuel to the fire, Ravencoin showed significant hidden bullish divergence on the 4-hour chart right on the support line. I took this as a clear sign of likely continuation up. The most attractive aspect of this trade was that a tight stop was justified and my idea would be quickly invalidated if I was incorrect.

RVN BTC 4-hour chart. Source: TradingView
How it worked out
Poorly. Bitcoin dropped within hours of this trade, and I was stopped out with little fanfare. This trade went south within 24 hours. I lost 1.68% on the trade but this was far less as a percentage of my overall trading portfolio.
The views and opinions expressed here are solely those of the (@scottmelker) and do not necessarily reflect the views of Cointelegraph. Every investment and trading move involves risk. You should conduct your own research when making a decision.