Bitcoin (BTC) quickly reversed its trajectory after a sharp decrease on Oct 13 and managed to break out later in the day.
While it seems to be approaching the top of its upward movement, BTC is expected to complete one final upward movement before correcting.
BTC breaks through resistance
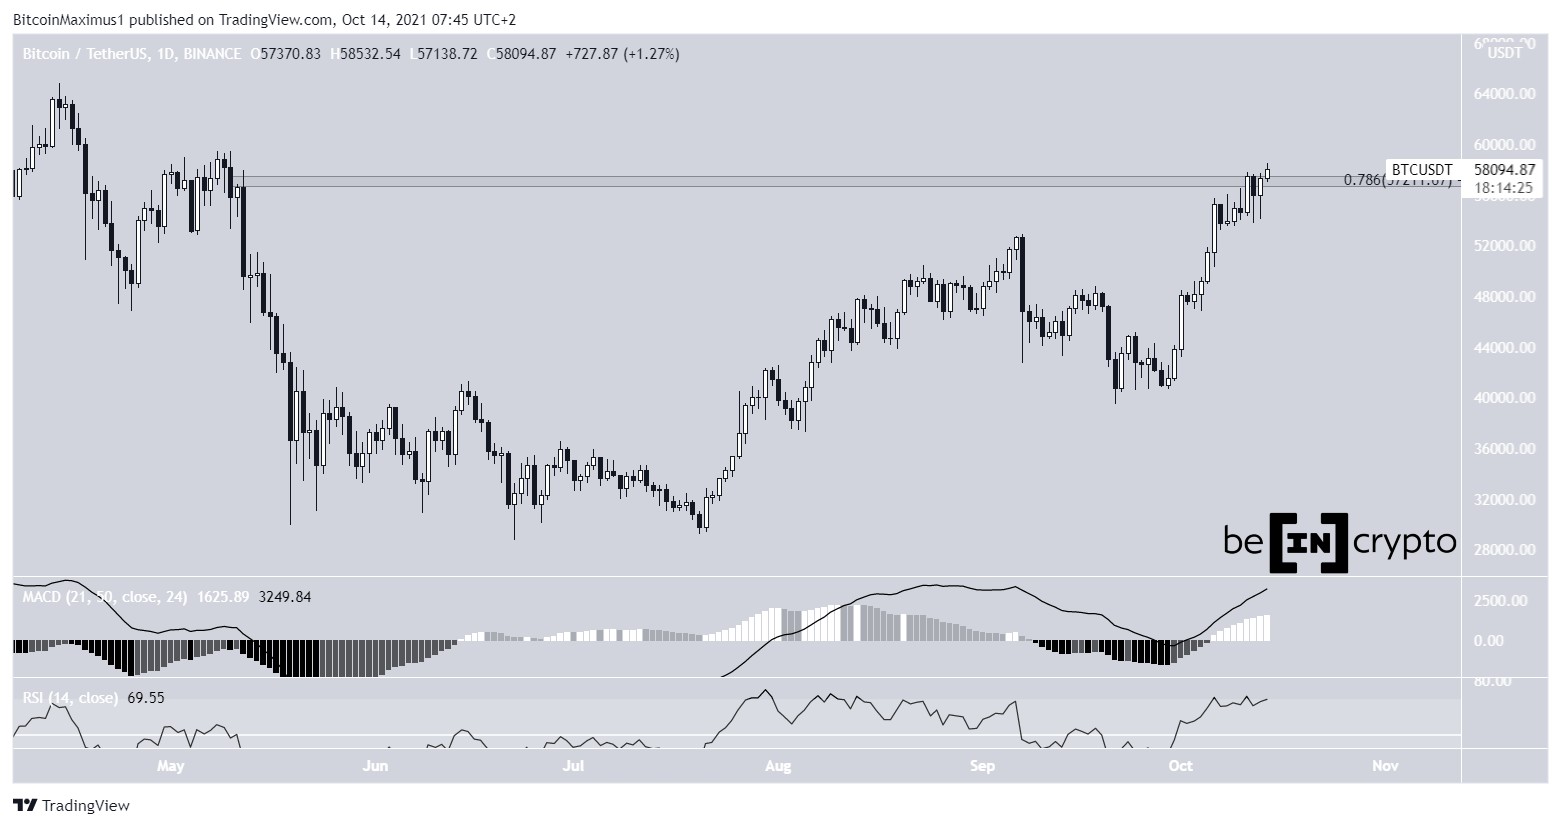
Bitcoin began Oct 13 with a sharp decrease, which briefly took the price to $54,000. However, it quickly reversed, leaving a long lower wick in place. This is a sign that there is still significant buying pressure at these levels,
BTC has now finally moved above the $57,200 resistance, which is both a horizontal resistance area and the 0.786 Fib retracement resistance level. It’s the final resistance prior to a new all-time high price. If the price does not fall back today, it would be the first daily close above this resistance area since the beginning of May.
Technical indicators are bullish — the MACD is positive and increasing. This indicator is created by both short and long-term moving averages. The reading means that the short-term trend is moving faster than the long-term trend.
The RSI has also moved back above 70. The RSI is a momentum indicator, and the movement above 70 shows a strong bullish trend, though it has now crossed into the overbought region.
Therefore, readings from the daily time frame indicate that the trend is still bullish.

Future movement
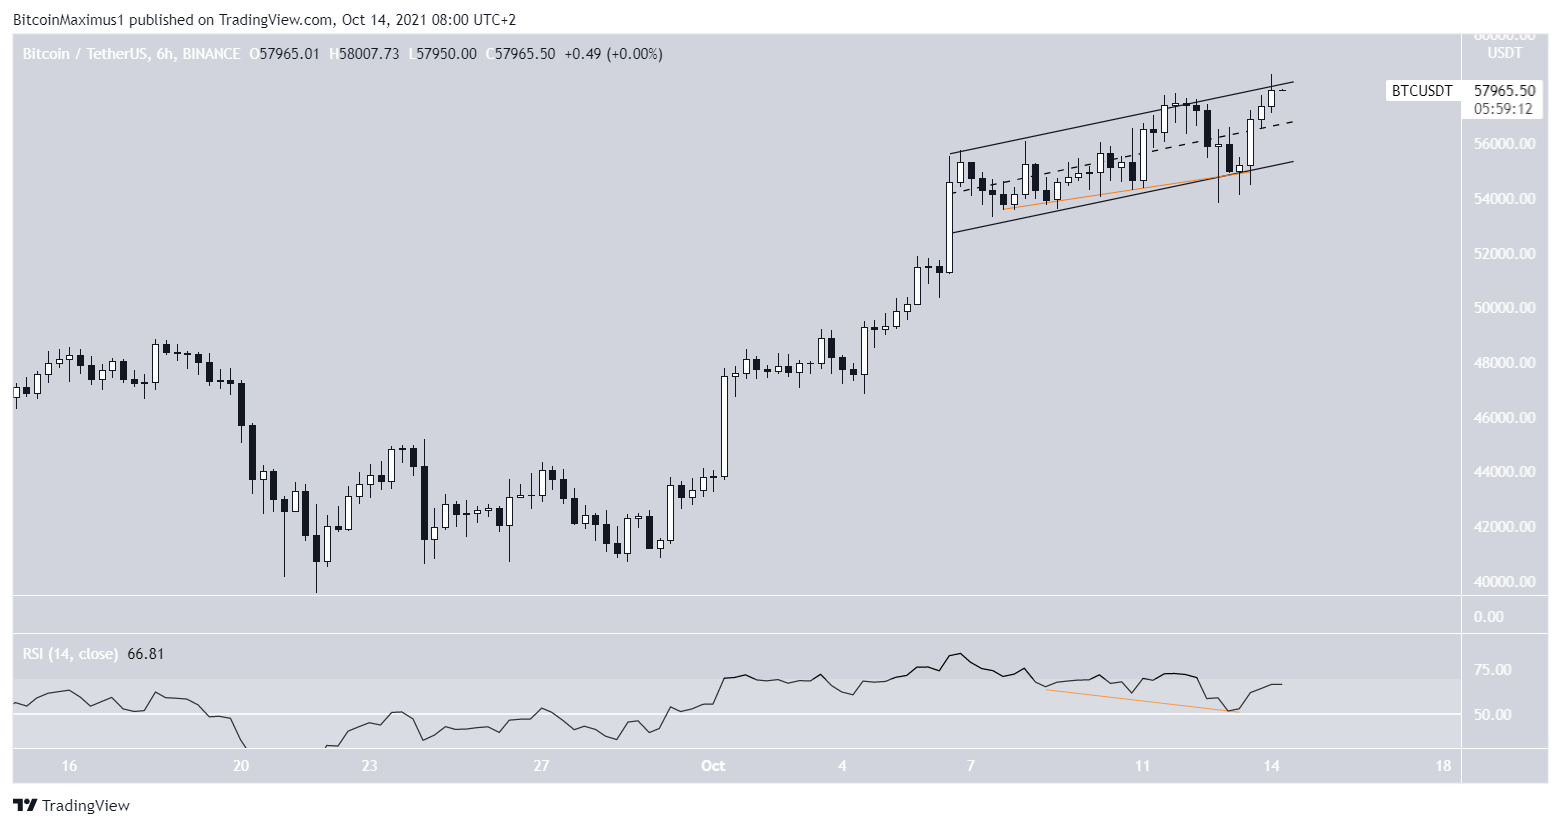
The six-hour chart shows that BTC is in the process of breaking out from an ascending parallel channel.
In addition to this, it shows that the upward move resumed after the RSI generated a hidden bullish divergence (yellow line). This is a very strong sign of trend continuation that usually leads to the previous upward move resuming.
The potential breakout from this channel will most likely accelerate the rate of increase.

Wave count
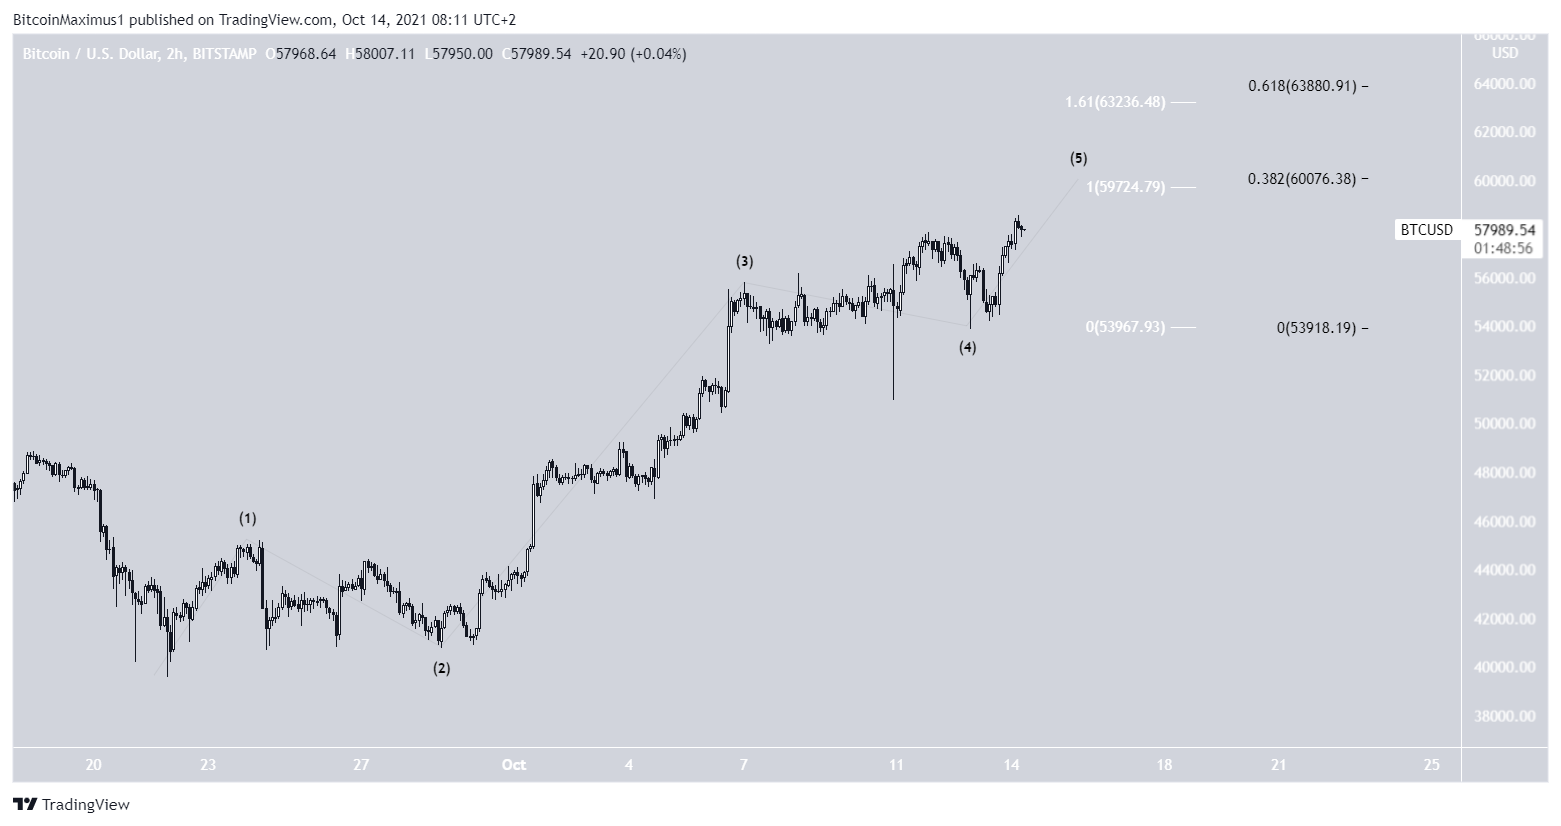
The short-term wave count suggests that BTC is in the fifth and final wave of its bullish impulse. This means that after this phase is complete, a corrective period will follow.
The two most likely targets for the top of the count fall between $59,700-$60,000 and $63,250-$63,850. These target ranges are found using the length of wave one (white) and the length of waves 1-3 (black).

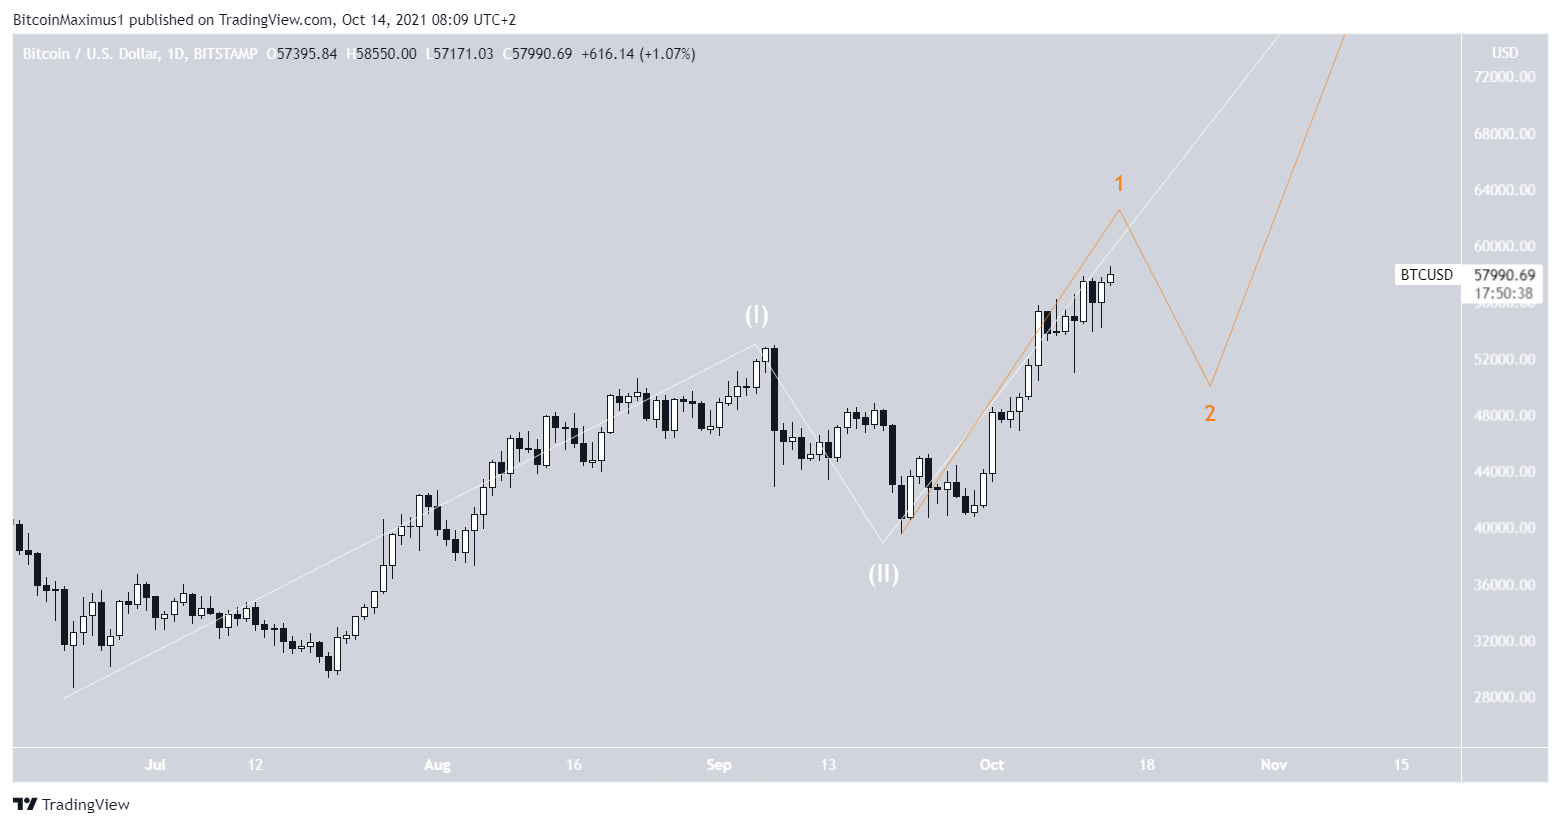
The long-term wave count shows that BTC is in a 1-2/1-2 wave formation. This suggests that the increase is expected to accelerate as soon as the correction is complete.

 beincrypto.com