Currently down 33% from its yearly high, Bitcoin still has some room left to fall. With momentum approaching oversold conditions, we today look at our 2016 comparison from last week to see if the similarities are still in play. This is the BTC analysis for 17 July 2019
Highlights:
- We look at 2016 comparison again
- Daily RSI approaching oversold conditions
- $10,000 resistance
- $8,400 main target
Starting with the 2016 price action chart to get a quick overview of RSI, we can see that after every heavy uptrend, momentum reached oversold condition by falling below 40.
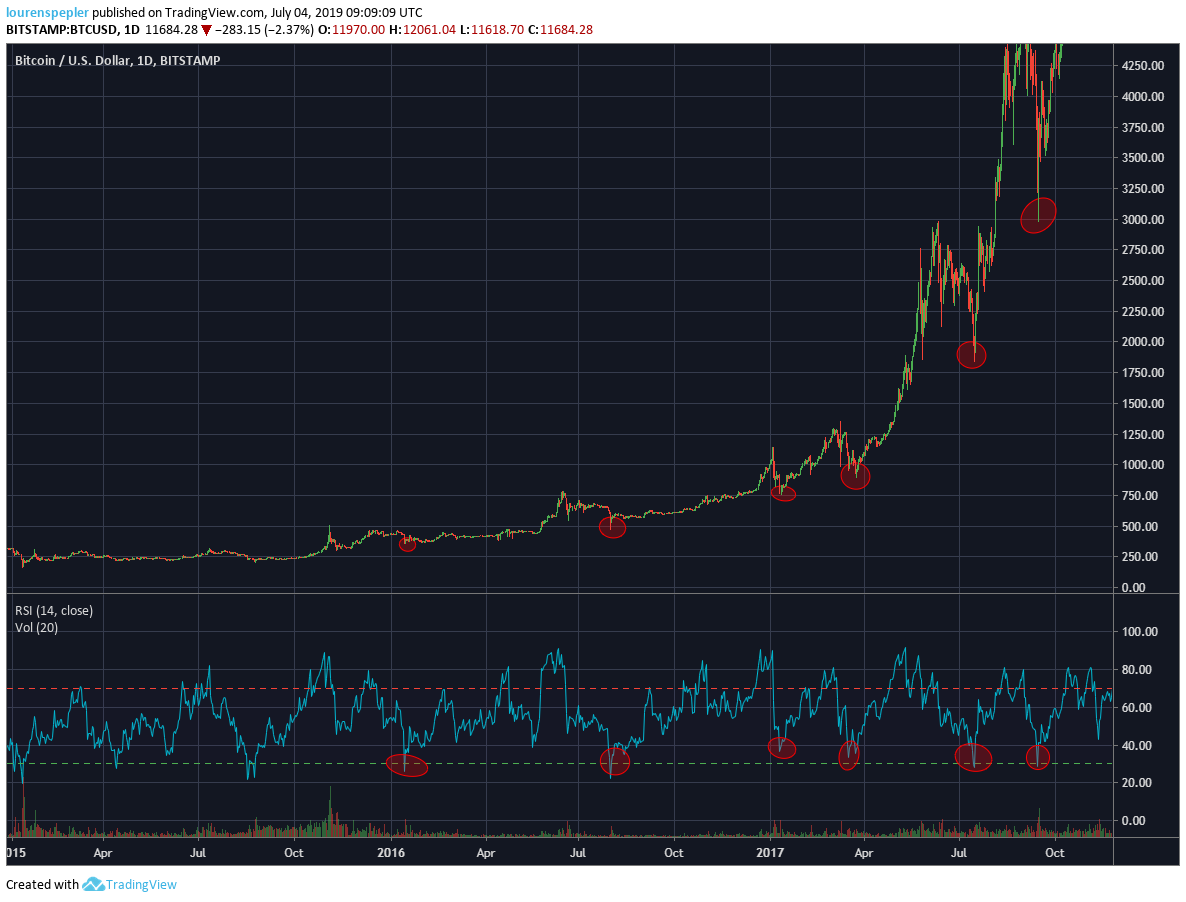
BTC/USD chart provided by Tradingview
Moving back to today's price action, we can see that BTC has had its heavy uptrend, which means we now have to wait for oversold conditions before we can expect new yearly highs. RSI is still making lower lows and lower highs, which tells us that BTC can still all further.
Currently RSI is pointing up on the daily, which could indicate that we will see an increase in price today, perhaps to test the nearest resistance, which looks to be like $10,000.
If we instead see momentum keep falling today, we would then see a break of $9200 support and possibly see BTC fall further down to our main target area of $8,400 for this larger retracement.
A dip in price to $8400 would surely bring the RSI down below 40 and perhaps even below 30, which will be the signal that BTC is oversold and that it is ready to move back up to make new yearly highs.
BTC/USD chart provided by Tradingview
Lastly, taking a look at the 15min chart for a better overview of today's price action, we can see that the dip of this past week has not had proper divergence. This means that we should still expect another dip is on the way, to form a new low on price, but a higher low on RSI. With momentum currently looking like it wants to make a turn back to 30 RSI, could indicate that we will soon see BTC decline in price and make its way towards $8400.
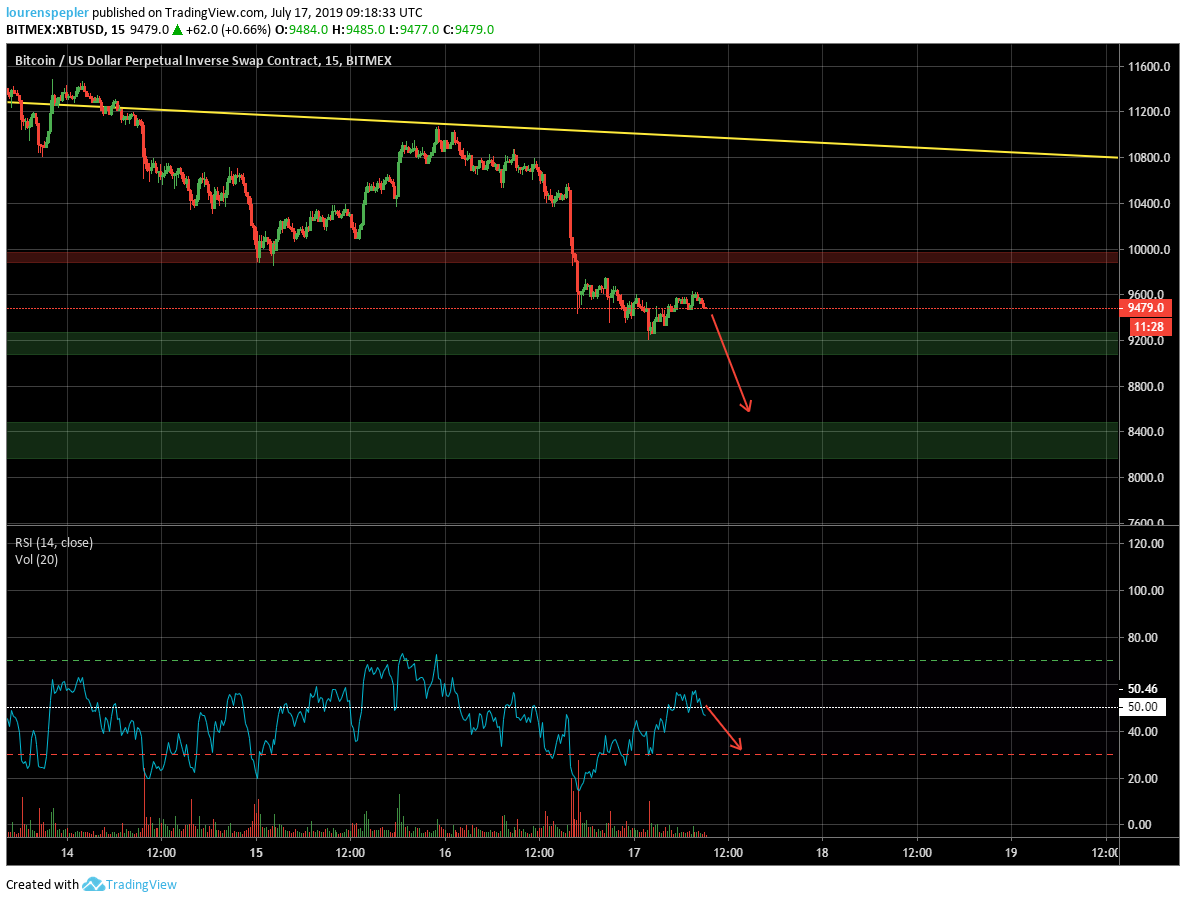
BTC/USD chart provided by Tradingview
Do you agree that BTC is close to finding the bottom for this decline and mirroring 2016 RSI structure, or will the falling momentum take us further down than we expect this time? Let us know what you think in the comments below!
Disclaimer: Keep in mind this not investment or trading advice, just the opinion of our analysts. As always, do your own research, make your own decisions.