
A favorite signal to look for among technical analysts, the ‘golden cross’ that appeared in bitcoin’s (BTC) price chart this week, has again gotten bitcoin holders excited about the coin’s near-term prospects. But if history is any guide, the signal’s predictive power is questionable, at least over the short-term.
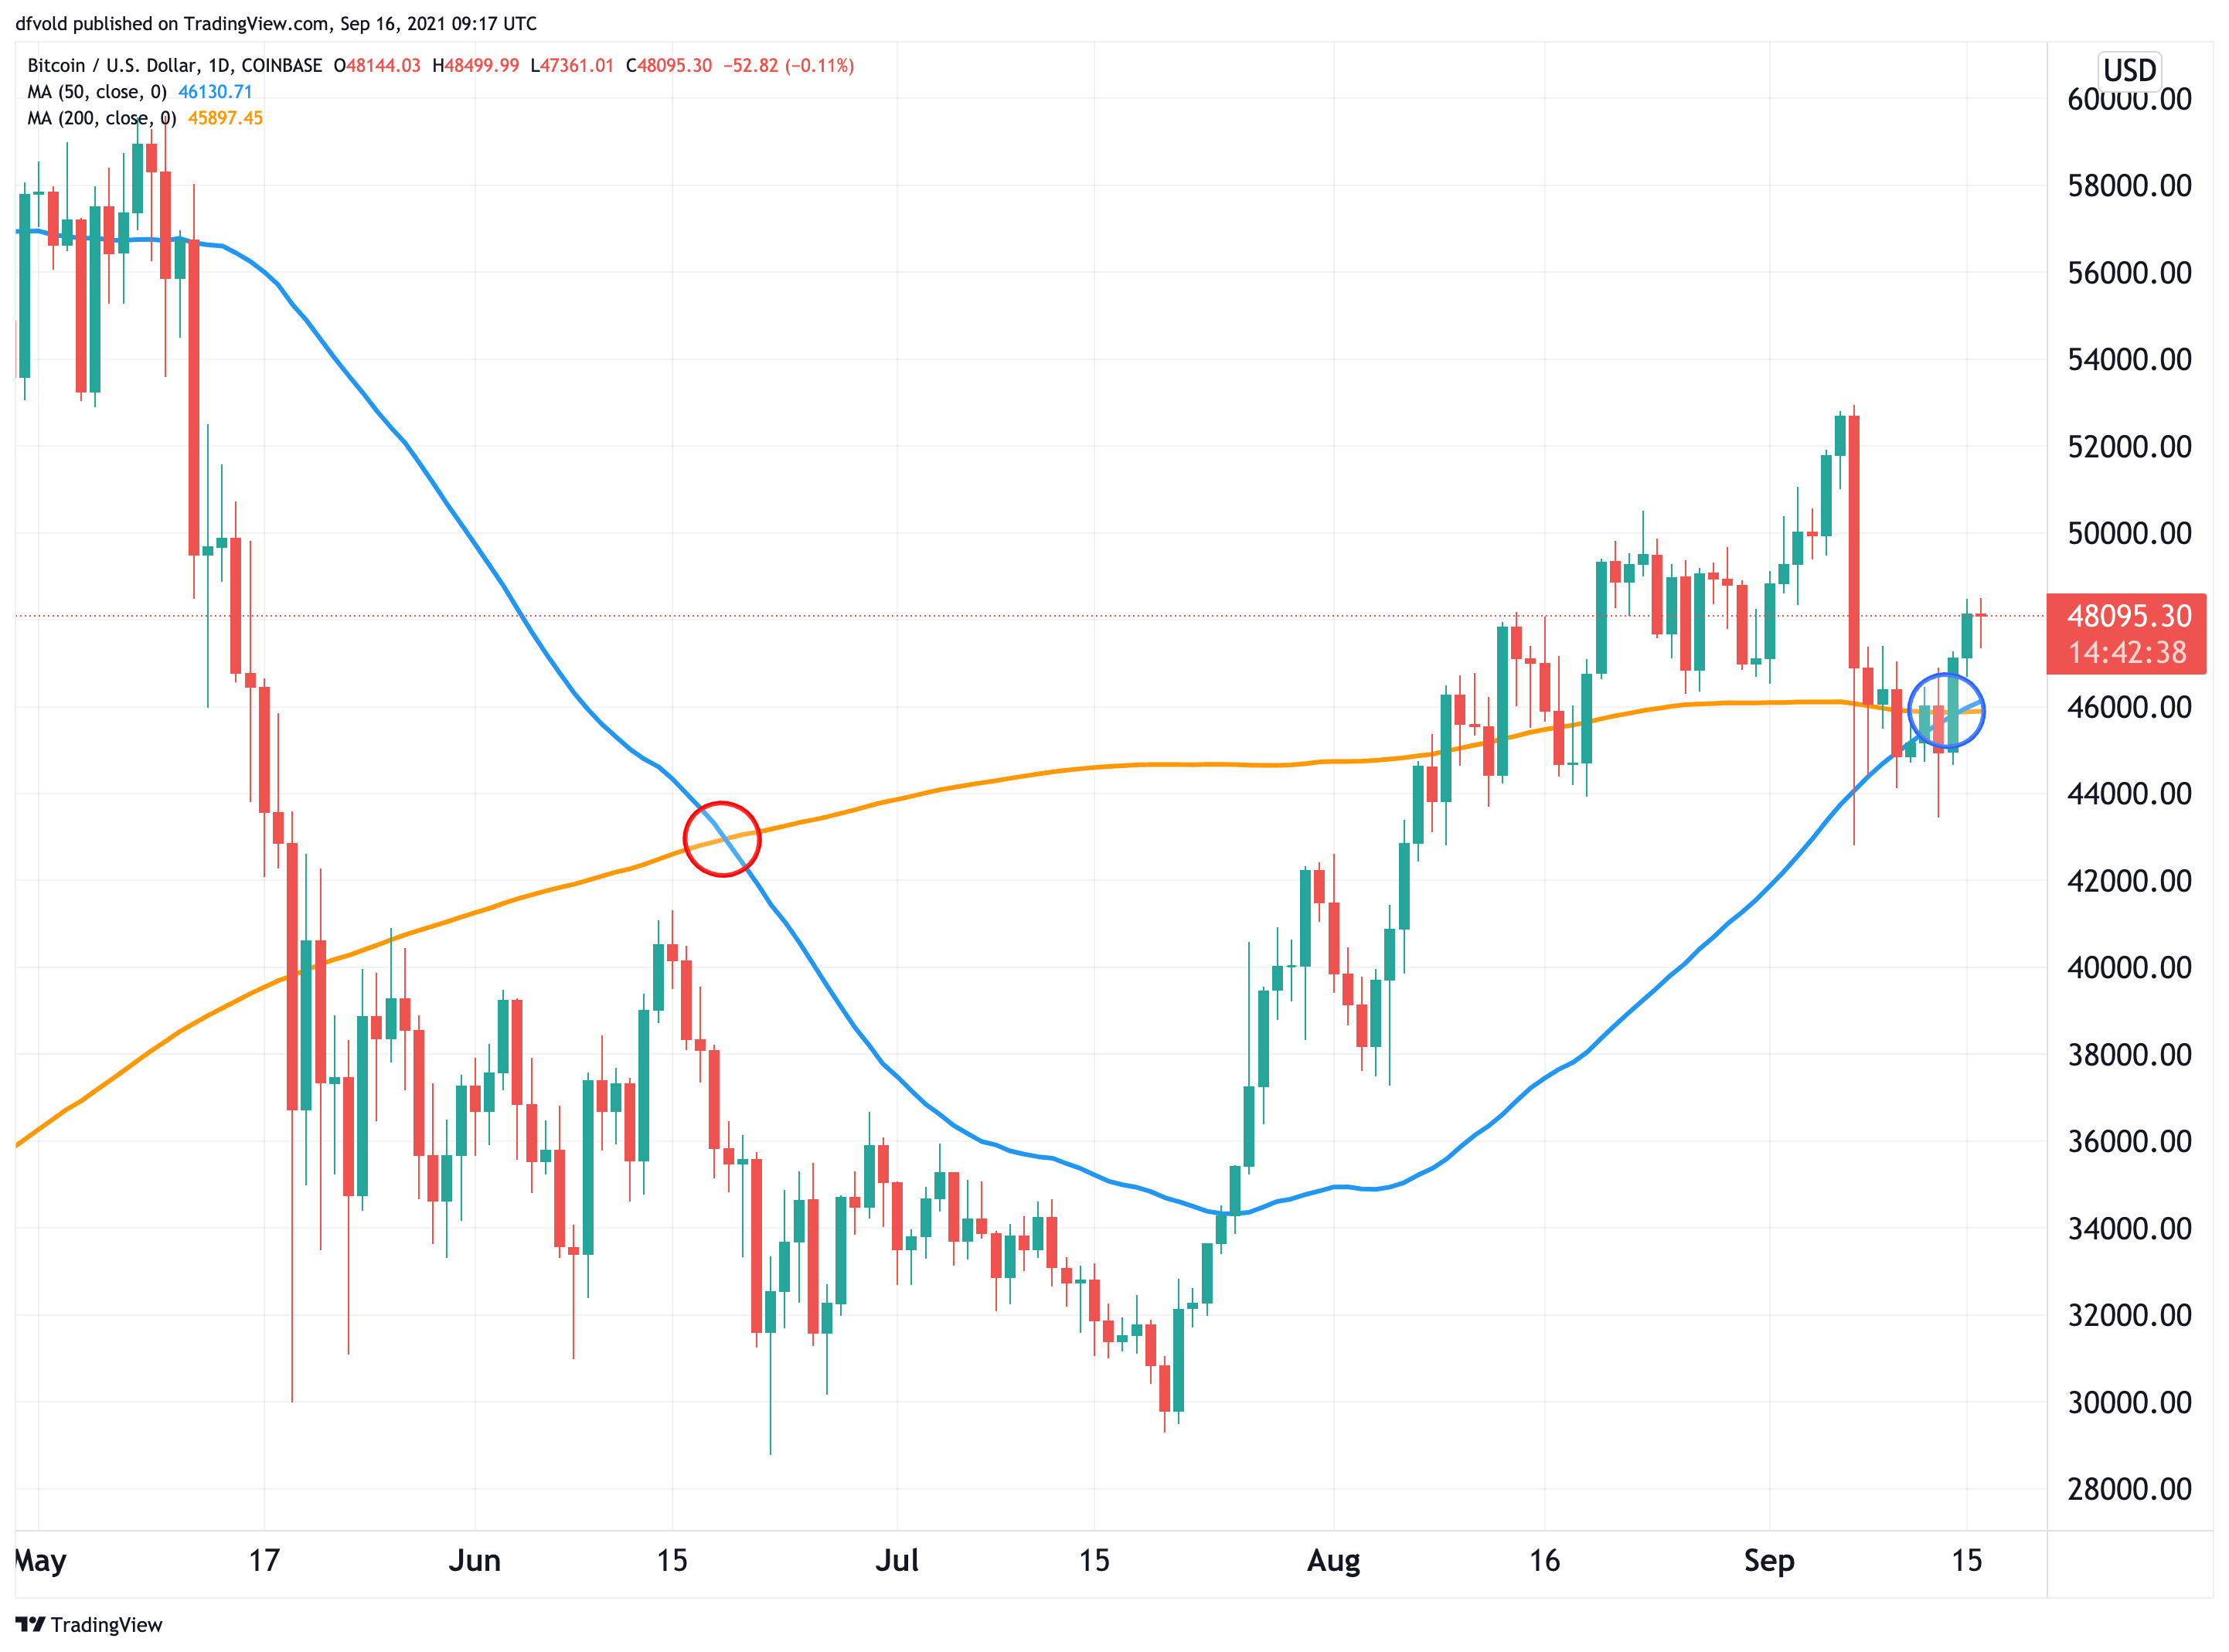
Defined as the crossing of the 50-day moving average over the 200-day moving average, the rare but popular signal again appeared on the bitcoin chart between Tuesday and Wednesday this week.
This week’s golden cross comes after bitcoin in June printed a ‘death cross’, which turned out to indicate mainly that the market had already fallen significantly, without much predictive power.
And although the golden cross is generally seen as a bullish signal, most analysts agree that it should mainly be seen as a confirmation that the asset has been in a sustained uptrend, which may or may not continue into the future.
According to research done by the crypto exchange Kraken, both the 7-day and 30-day returns have been negative on average for traders who chose to buy bitcoin on the day of its golden crosses.
However, the signal may be more reliable when looking at the longer-term, the researchers suggested.
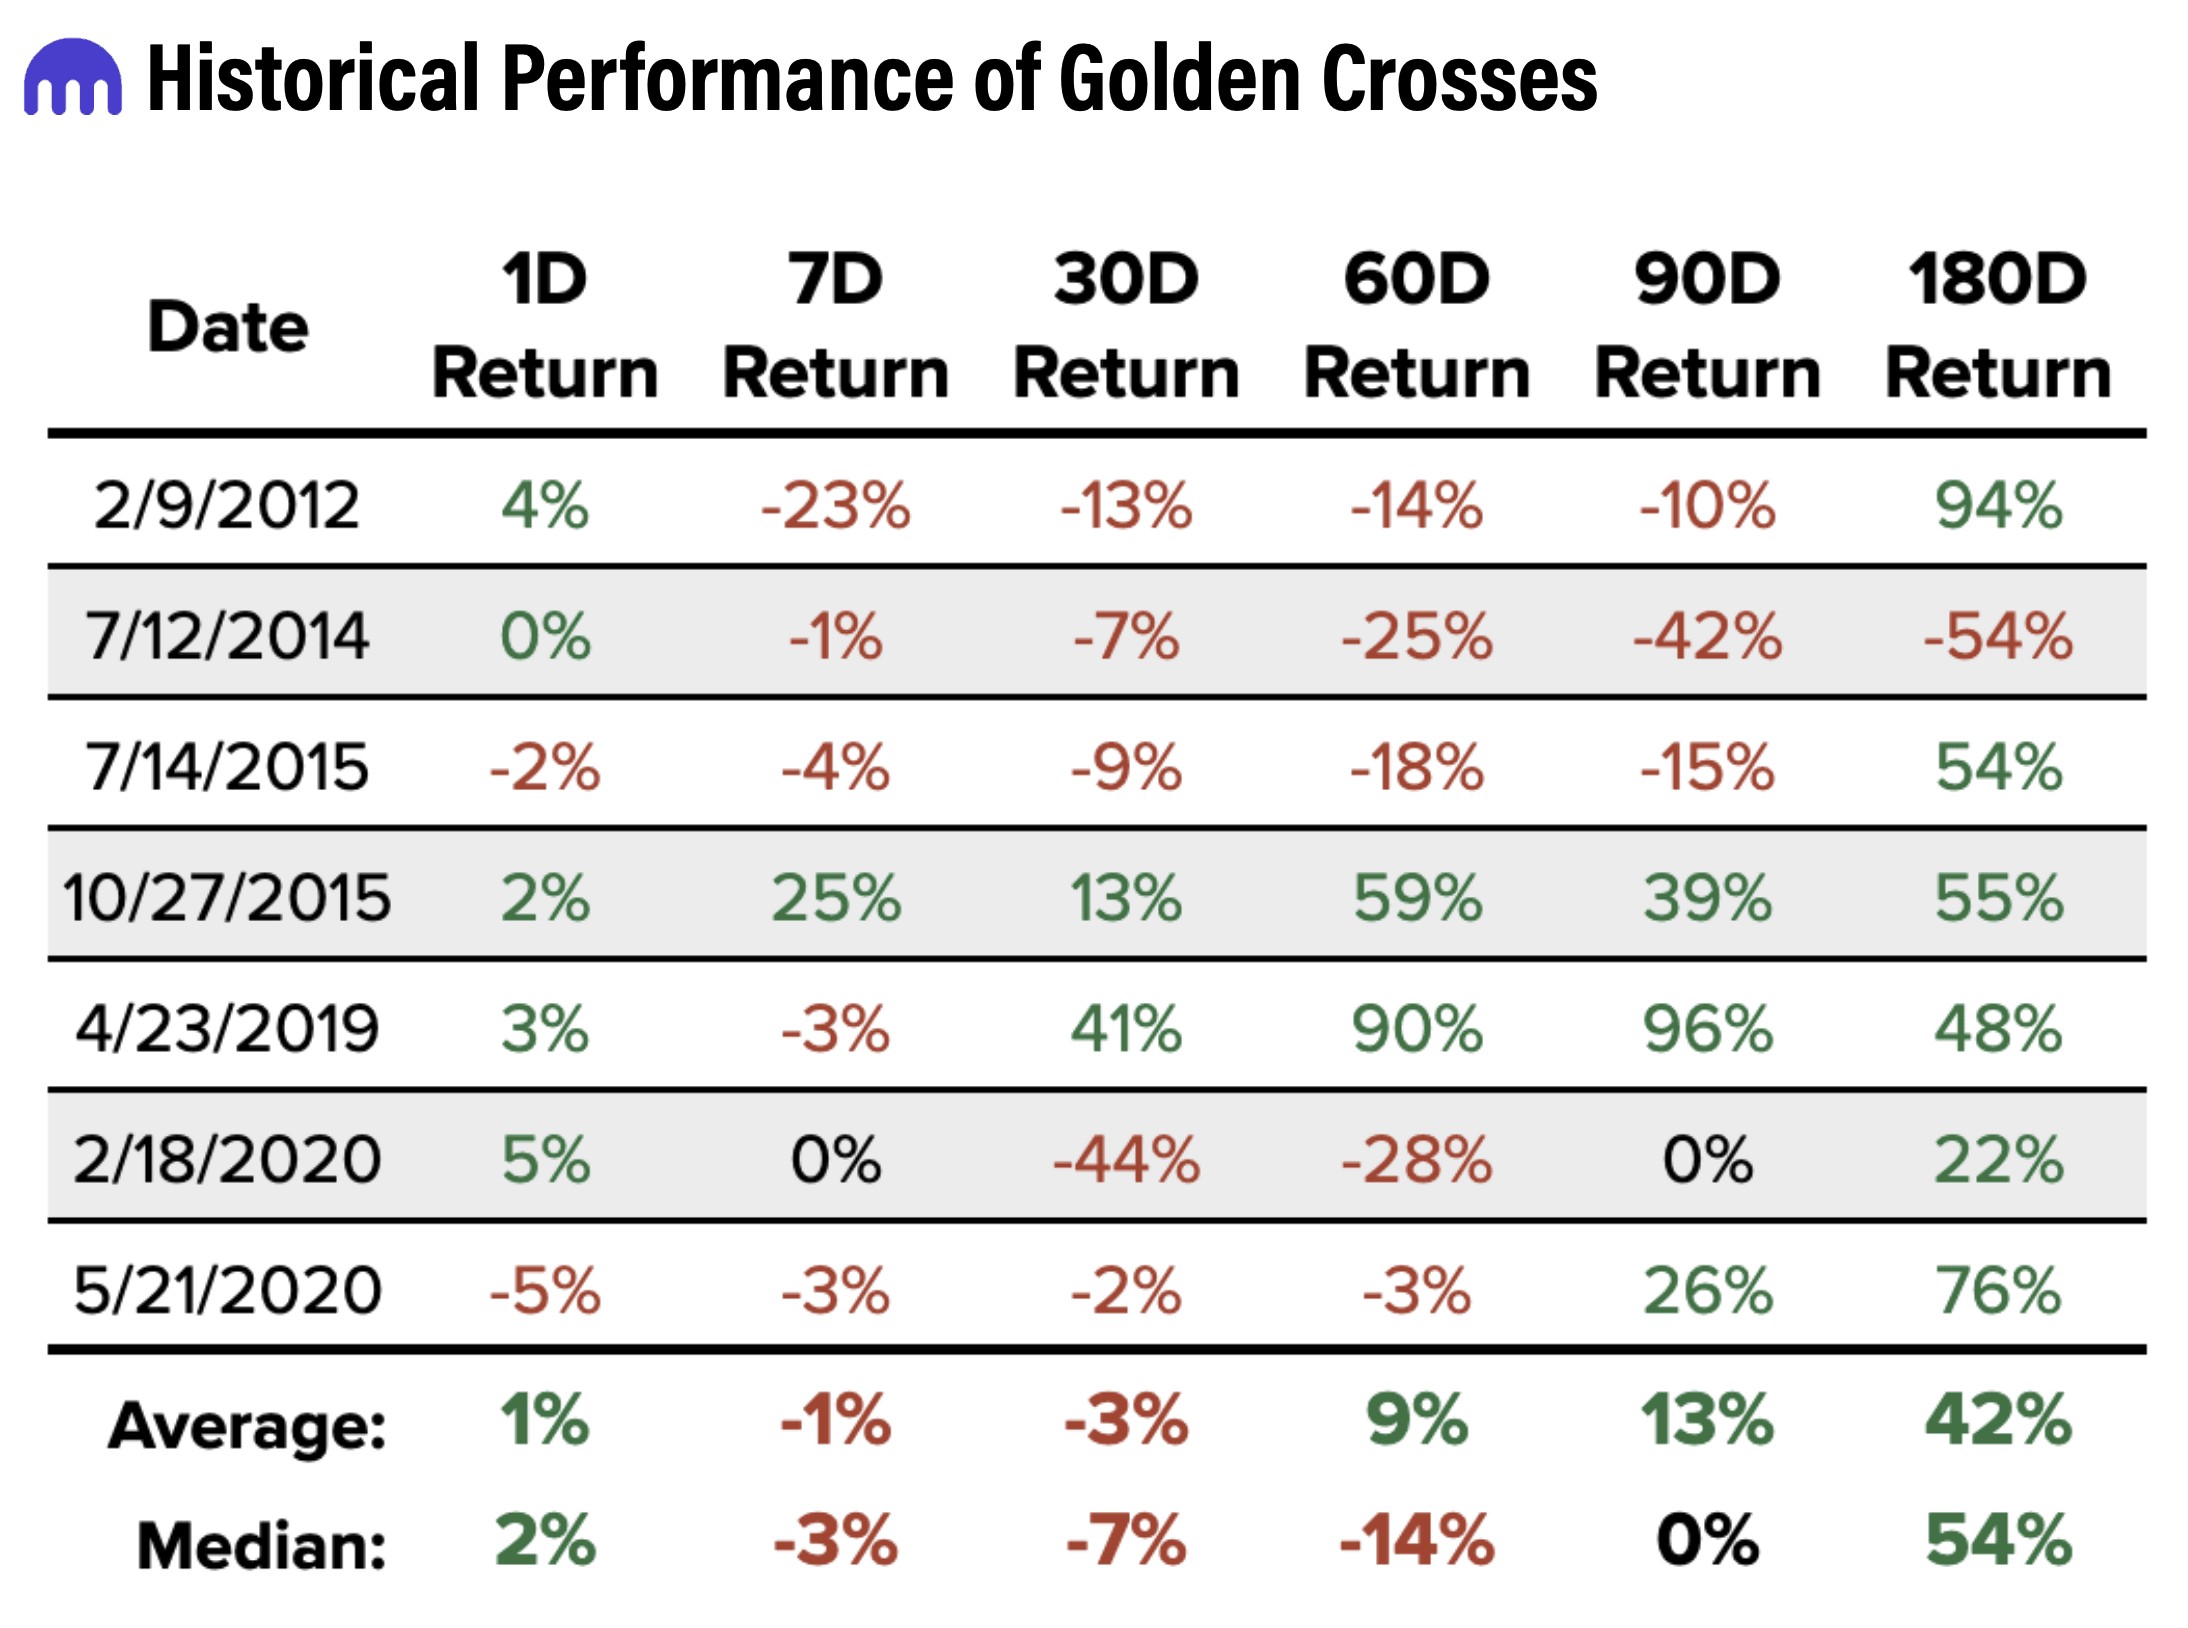
“Since BTC's inception, we've seen 7 instances where BTC has formed a golden cross," Kraken Intelligence wrote in a report ahead of the latest bitcoin golden cross, adding:
"On average, BTC is little changed in the month that follows a golden cross. However, the average 90-day and 180-day return following a golden cross has been +13% and +42%, respectively.”
Also warning against blindly following the golden cross strategy was James Butterfill, an investment strategist at the crypto asset management firm CoinShares, who in a Twitter post this week said that he would advise clients to be “cautious.”
The golden cross signal “hasn’t been a consistent predictor of positive returns,” Butterfill wrote, while also sharing a graph showing how bitcoin has performed on different timeframes following previous golden crosses:
The last time a golden cross appeared in the bitcoin chart was on May 21, 2020, when the price was USD 9,520. Back then, the golden cross marked the beginning of bitcoin’s major bull market, which brought it to its all-time high of more than USD 64,000 over the next year.
Both the moving average lines themselves, and the crossing of them, are commonly watched among trend following traders and funds across many different asset classes, with some using them as thresholds to decide whether to take up ‘long’ or ‘short’ positions.
The opposite of the golden cross is the death cross, which occurs when the 200-day crosses over the 50-day moving average, generally indicating a bear market.
At 09:14 UTC on Thursday, bitcoin was up by almost 2% for the past 24 hours to a price of USD 48,131. The price is further up by just over 2% since the golden price appeared in the chart.
____
Learn more:
- Standard Chartered Sees Major Upside to Ethereum, Bitcoin
- Pantera CEO Trims Bitcoin Price Forecast For 2021, Sees ETH Outperforming
- Bitcoin May Surpass USD 66K in 2021 and USD 400K by 2030 - 'Panel of Experts'
- CBDCs, Stablecoins & Crypto Can Disrupt Traditional Finance – Moody’s
- SEC Chief May be Gunning for Crypto Exchanges and Altcoins
- European, Asian Investors Drive Bitcoin, Ethereum Investments - Survey