$4 billion in liquidations wiped out the derivatives market, sending BTC lower by 19% at the intraday lows yesterday. Crypto Twitter went into panic, as exchanges were unresponsive, investors struggled to fill orders, and fears of a bear market began to spread.
Days like yesterday make it easy to panic sell without thinking about what was actually happening. Although the charts looked horrible, on-chain data was flashing completely different signals, showing that long-term holders and large cohorts were not selling this pullback.
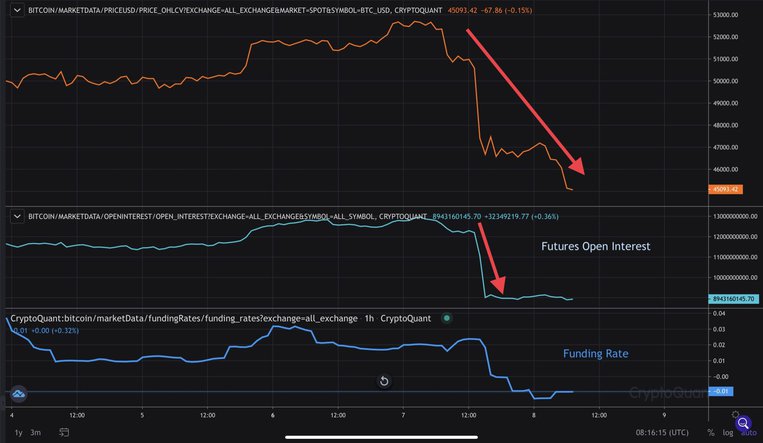
For the last few weeks, futures open interest have been soaring, increasing from $9 billion to a peak of $12.8 billion. Within hours after BTC crashed, open interest dropped from $12.8 billion back to $9 billion and has been holding steady since.
The speed of the massive drop in price made it look like whales and long-term holders were dumping, but this was mostly forced liquidations all happening at once, causing prices to fall until the next bid. In short, there was not enough demand at that time to absorb the billions in liquidations. This is the price the market pays for adding leverage and derivatives. When open interest rises quickly or a trade becomes stacked, leverage tends to be flushed out.
Did Strong Holders Sell?
The short answer is no. More importantly, long-term holders with coins more than 12 months old held steady throughout the entire liquidation event. This can be seen with CryptoQuant’s UTXO Age Distribution metric, which tracks the behavior of a variety of cohorts based on age.
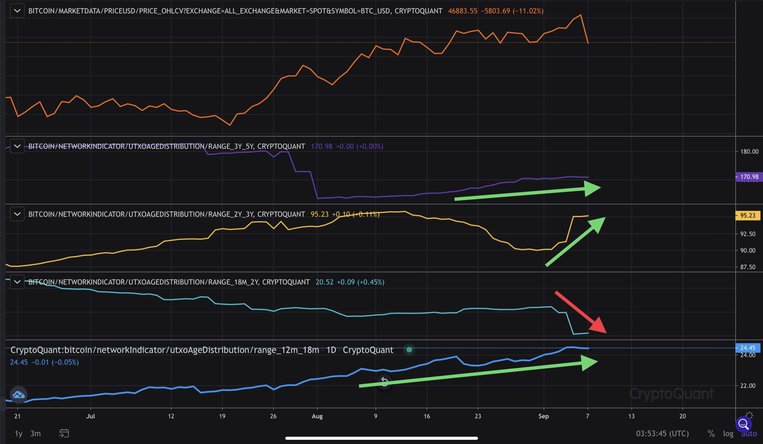
Various groups of holders with coins older than 12 months were slightly taking profit as BTC rallied towards $42k to $50k in the last few weeks, but the selling stopped, and these cohorts went back into accumulation. The 19% intraday pullback did not make any impact on these older coins. Note, 18-month to 2-year-old coins are aging, causing a coincide dip with an increase in 2 to 3-year-old coins.
Who Sold?
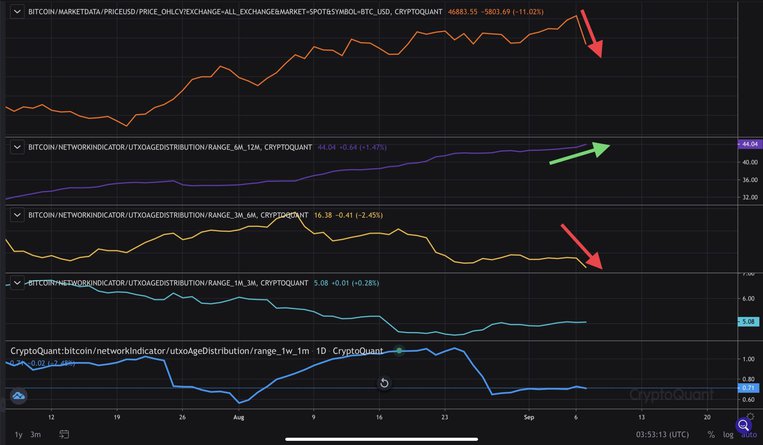
The younger coins or short-term holders were the ones who sold this pullback along with the long liquidations. The 3 to 6-month cohort in particular sold, as shown in the chart below. This group accumulated BTC earlier this year between $50k to $64.8k, panic sold the lows at $30k, and has now aged into the 3 to 6-month cohort and once again panic sold the recent dip to $42.8k.
Miners Sold 2855 BTC, Still Holding 1,847,000 BTC
Miners have been in net accumulation this entire year despite the 55% drawdown in May. This is a very bullish signal despite a recent outflow of 2855 BTC from miner wallets to exchanges. It may appear bearish to see them sell 2855 BTC yesterday, but when comparing late 2020 flows of nearly 40,000 BTC to exchanges to be sold, with multiple 10,000 to 30,000 outflows, the recent flows can barely compare in size.
It’s important to focus on the overall trend, not on one-time spikes in flows or movement. The trend of miners firmly remains bullish as they are accumulating more BTC than they are selling, causing reserves to increase this year with minimal outflows to exchanges to sell in the last few months. This strongly signals BTC miners are expecting higher prices later this year.
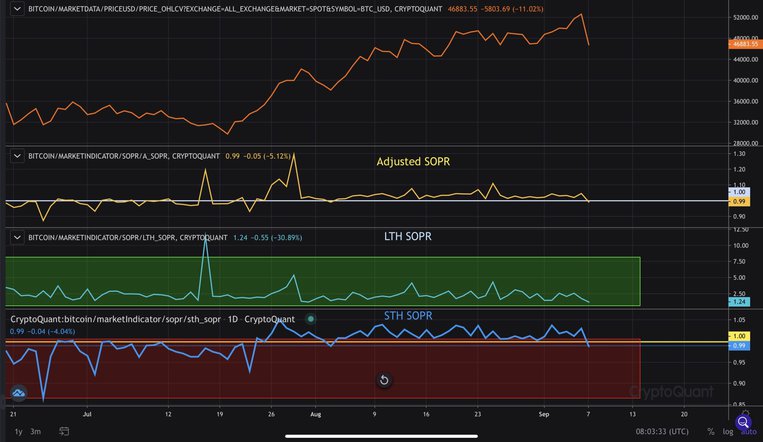
As of now, the aSOPR metric or adjusted spent output profit ratio has dipped slightly below 1, meaning the market as a whole is trading at a slight loss. In a bullish uptrend, this can be seen as an attractive opportunity to add.
The LTH SOPR, which measures long-term holder’s state of profitability, remains above 1 and has been even with the 55% drawdown in May 2021. This is a strong signal of strength in holders as they were not affected by the massive liquidation events. With the current pullback, STH SOPR is back below 1, signaling short-term holders are trading at a loss.
CryptoQuant on-chain analyst Gaah Cordeiro recently pointed out how now is a great time to accumulate BTC when the LTH SOPR is above 1, the STH SOPR is below 1 in a bullish uptrend. It simply means short-term holders are selling at a loss while long-term holders scoop up cheap BTC during pullbacks.
Another important point to consider is bear markets occur when the LTH SOPR is consistently below 1, meaning that long-term holders are at a loss. Even the 55% pullback in May 2021 never pushed the LTH SOPR below 1, strongly indicating this was not a bear market but a mid-cycle pullback.
Technicals Shaken But Higher Time Frame Charts Still Bullish
The massive liquidations managed to send BTC all the way down to the 50-day MA at $44.2k yesterday and again today at $44.4K. Price wicked down to these levels and wicked back up, a sign of buyers coming into the market.
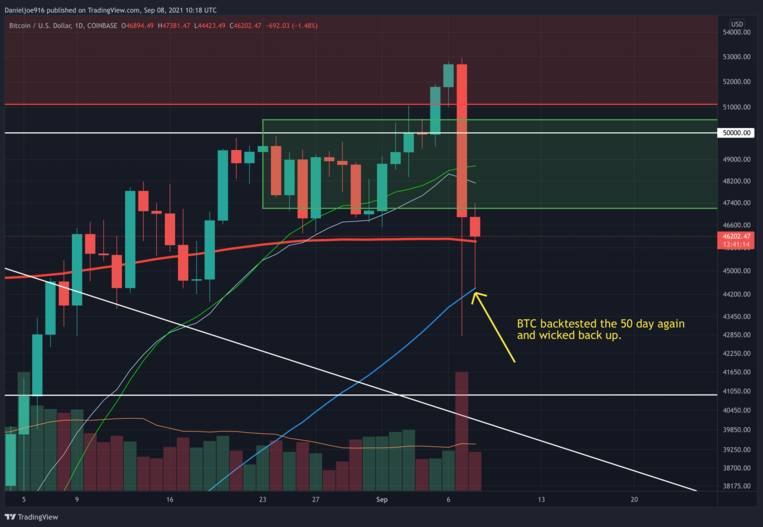
So far, BTC is holding the 2-week consolidation lows at $46.3k on a daily closing basis, which is overall a positive signal. It is important for BTC to protect the 200-day at $46k for the rest of the week and start pushing back higher to reclaim $47.2k, a key on-chain level with high UTXO realized price distribution.
The green zone between $50.5k and $47.2k has been taken out on an intraweek basis so far. It is important to see long liquidations cool off and see BTC pushing higher into the green zone. Once this happens, we can expect selling pressure to weaken and prices to push higher.
The Dip is Being Bought
As of yesterday, spot exchange reserves fell as net outflows came in at -3366 BTC. This includes total spot inflows of 16,178 BTC and total spot outflows of 19,544 BTC. With price falling and BTC being withdrawn from exchanges, this strongly indicates BTC was being accumulated. On-chain data has shown the strong hands were not selling this dip, with selling pressure from long liquidations and panic selling from weaker hands.
What Can We Expect Next?
Post liquidations can push prices around for a few days. Ideally, given strong hands and entities holding illiquid supply were not selling, we can expect the price to start recovering once long liquidations are complete. If longs keep jumping in at current prices of around 46k, this could actually trigger more liquidations. It would be good to see shorts pile up at current prices and start pumping to start a liquidation to the upside.
Regardless of this pullback, the market remains deep in supply shock, with the majority of entities continuing to hold. This means that, as long as accumulation continues, there will be less BTC available on exchanges, which helps drive prices higher when another wave of demand comes. Although price action looks bearish near-term, the fundamental, higher time frame technicals, on-chain, and momentum remain in a bullish trend, suggesting this is only a liquidation event with bullish continuation to come.
It is important to see the price recover and on-chain metrics continue to show strength in accumulation with no signs of whale exit liquidity. If these bullish trends continue, we can expect the bulls to push prices back up into the green zone and eventually retest $50k.