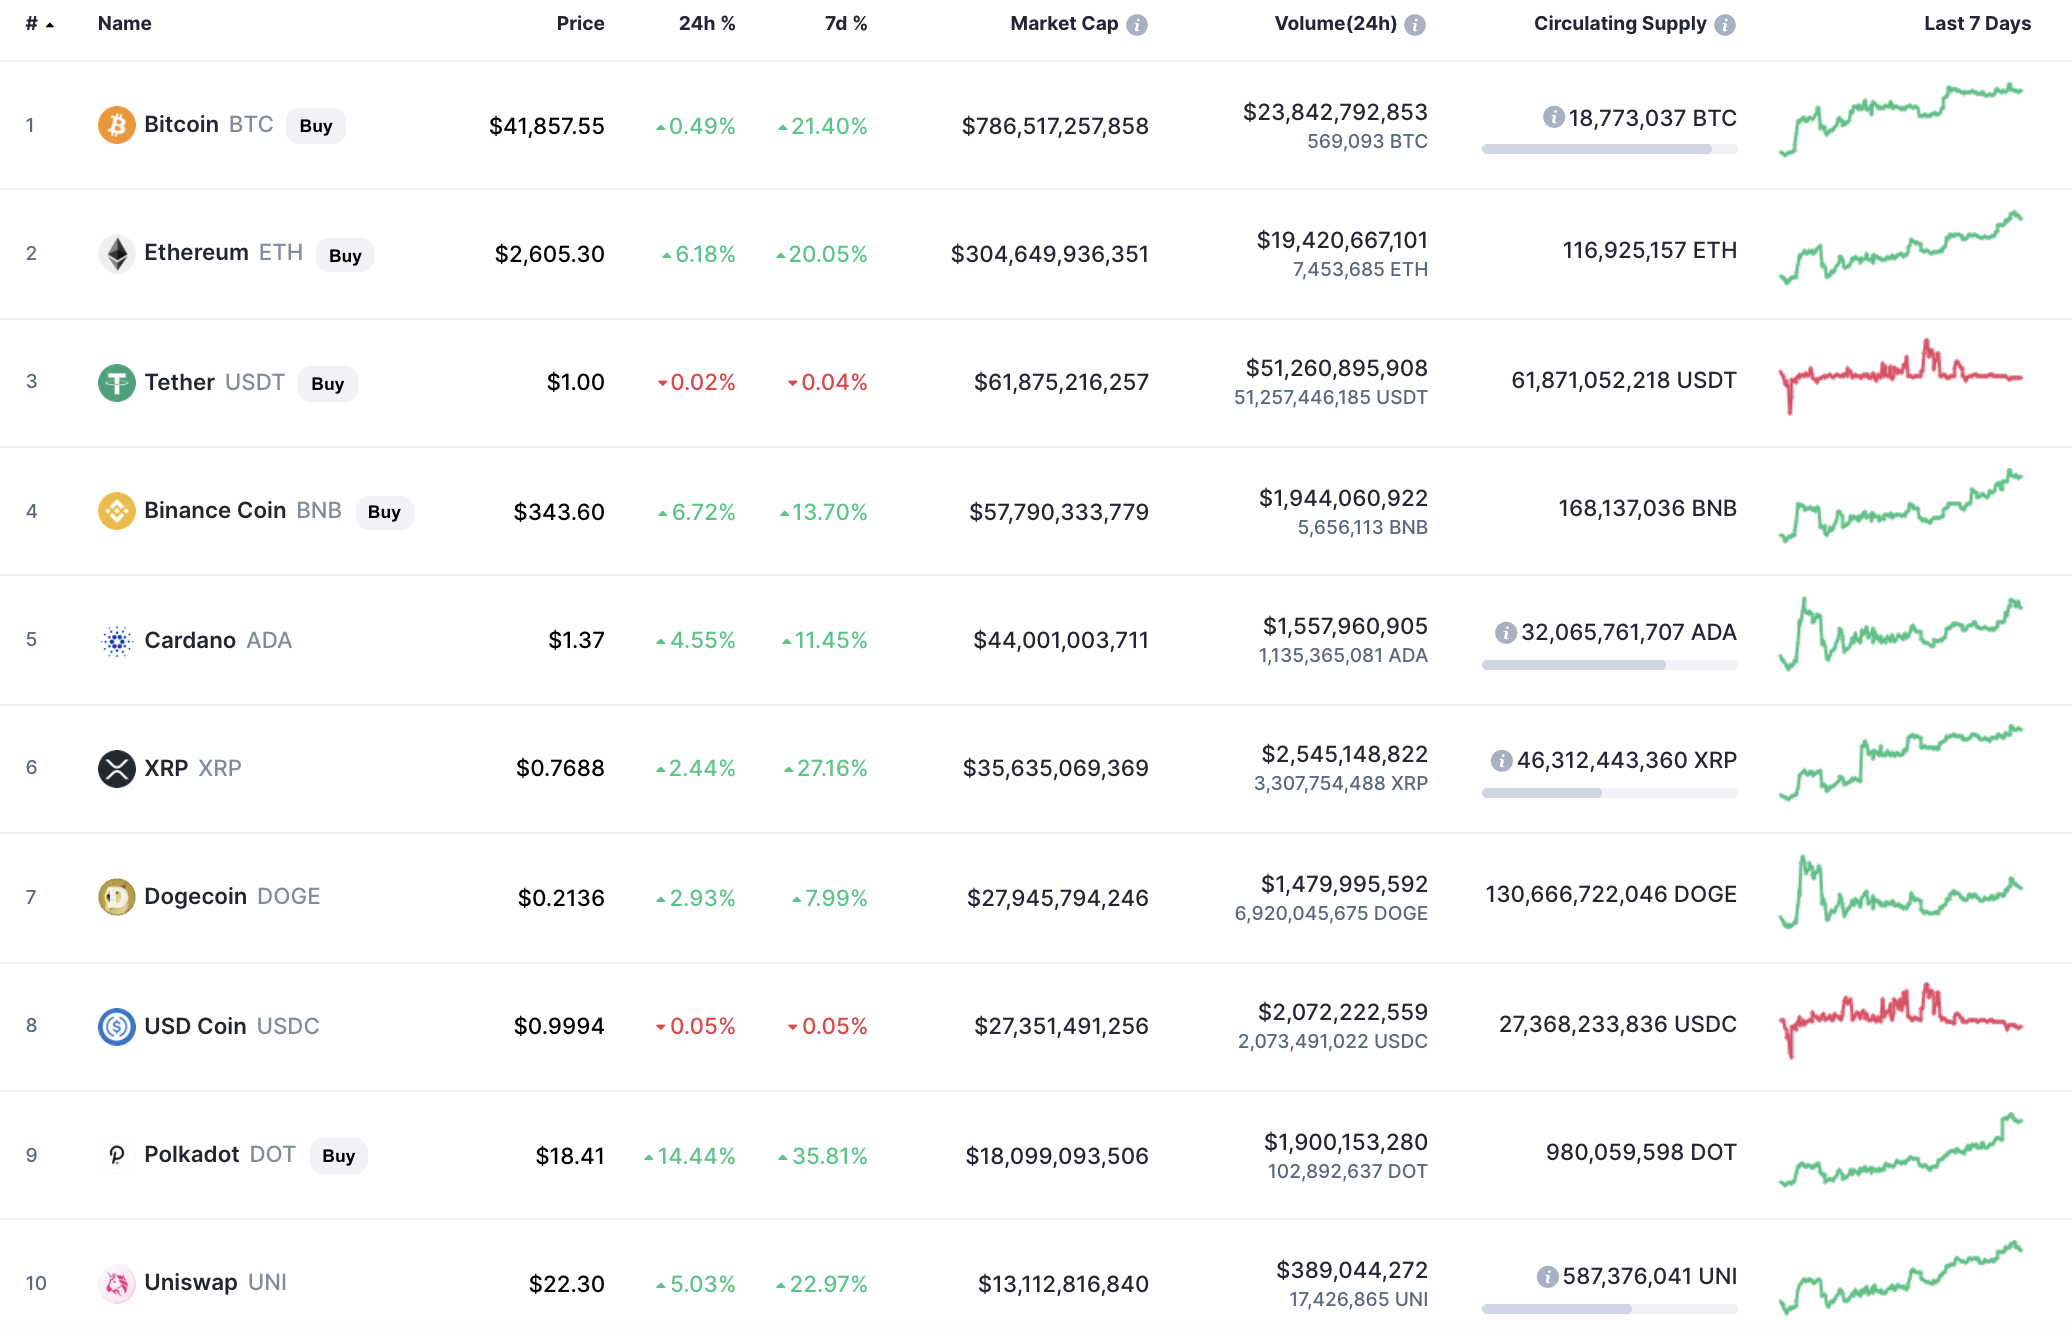
The first day of August has begun positively for the cryptocurrency market as all of the top 10 coins are in the green zone.
BTC/USD
The passing week has been positive for Bitcoin (BTC) as its rate has risen by 21%.
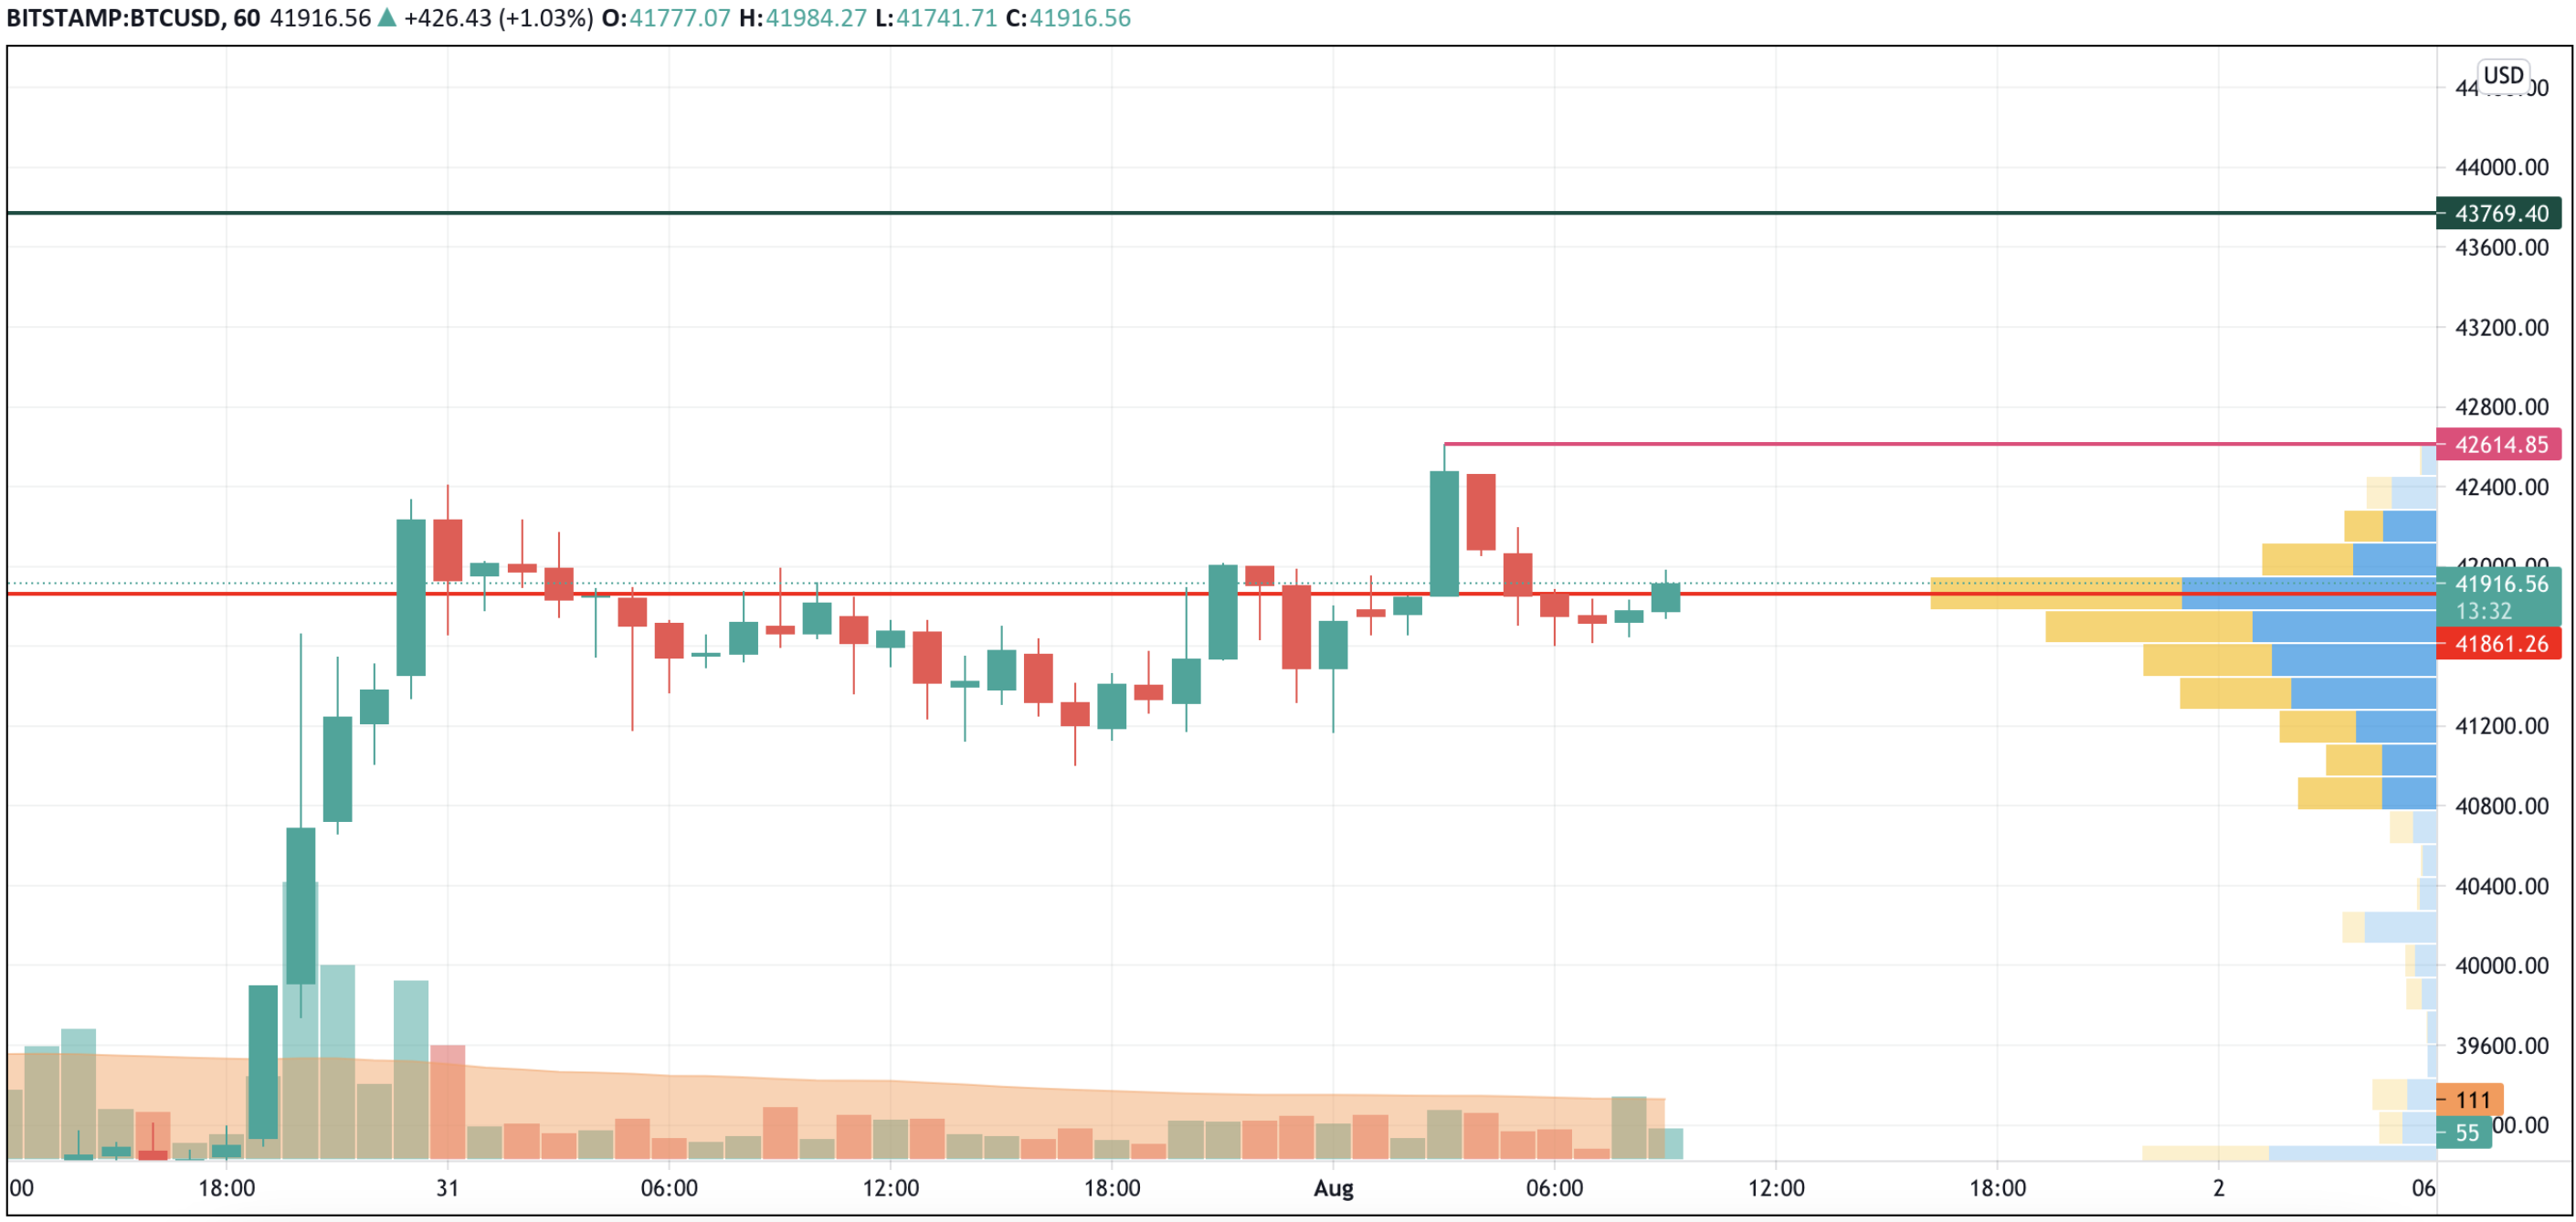
On the hourly chart, Bitcoin (BTC) set the local peak at around $42,614, followed by a short-term decline. After testing the liquidity zone at $41,800, bulls are trying to come back, accompanied by increasing trading volume.
If they can manage to break the local resistance, there are chances to get to $43,000 by the end of the day.
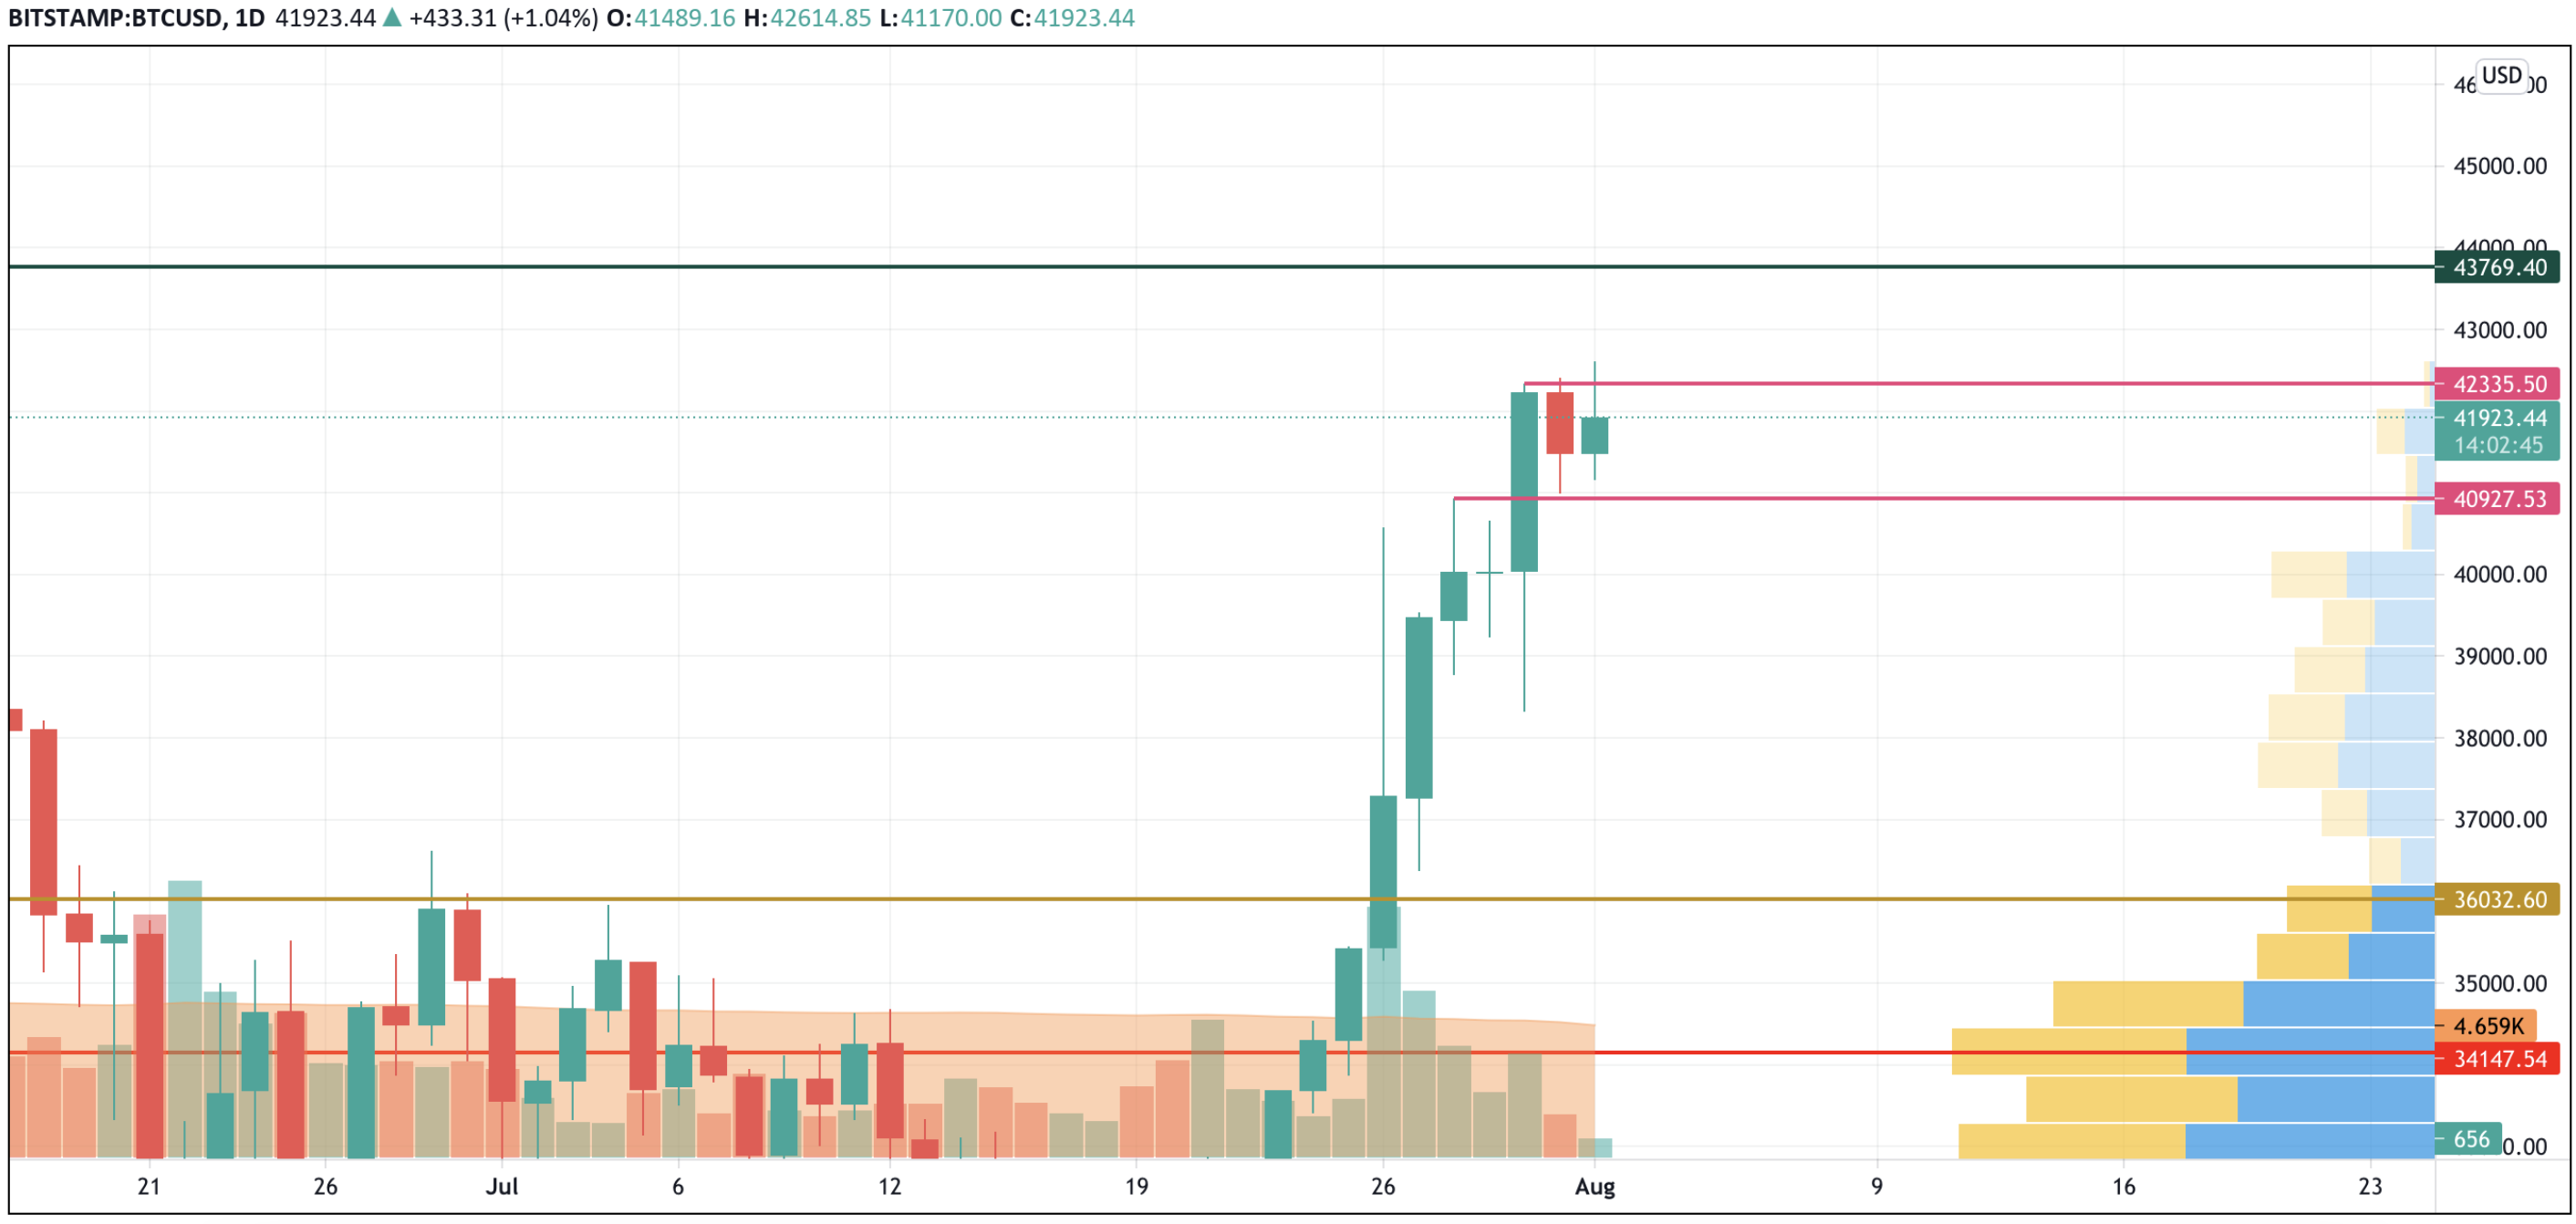
On the bigger time frame, the chief crypto is stuck between the support at $41,000 and resistance at $42,335. The trading volume has declined, which means that traders are still accumulating power for a price blast. If they break the resistance, the next level of $43,700 may be attained by the end of the next week.
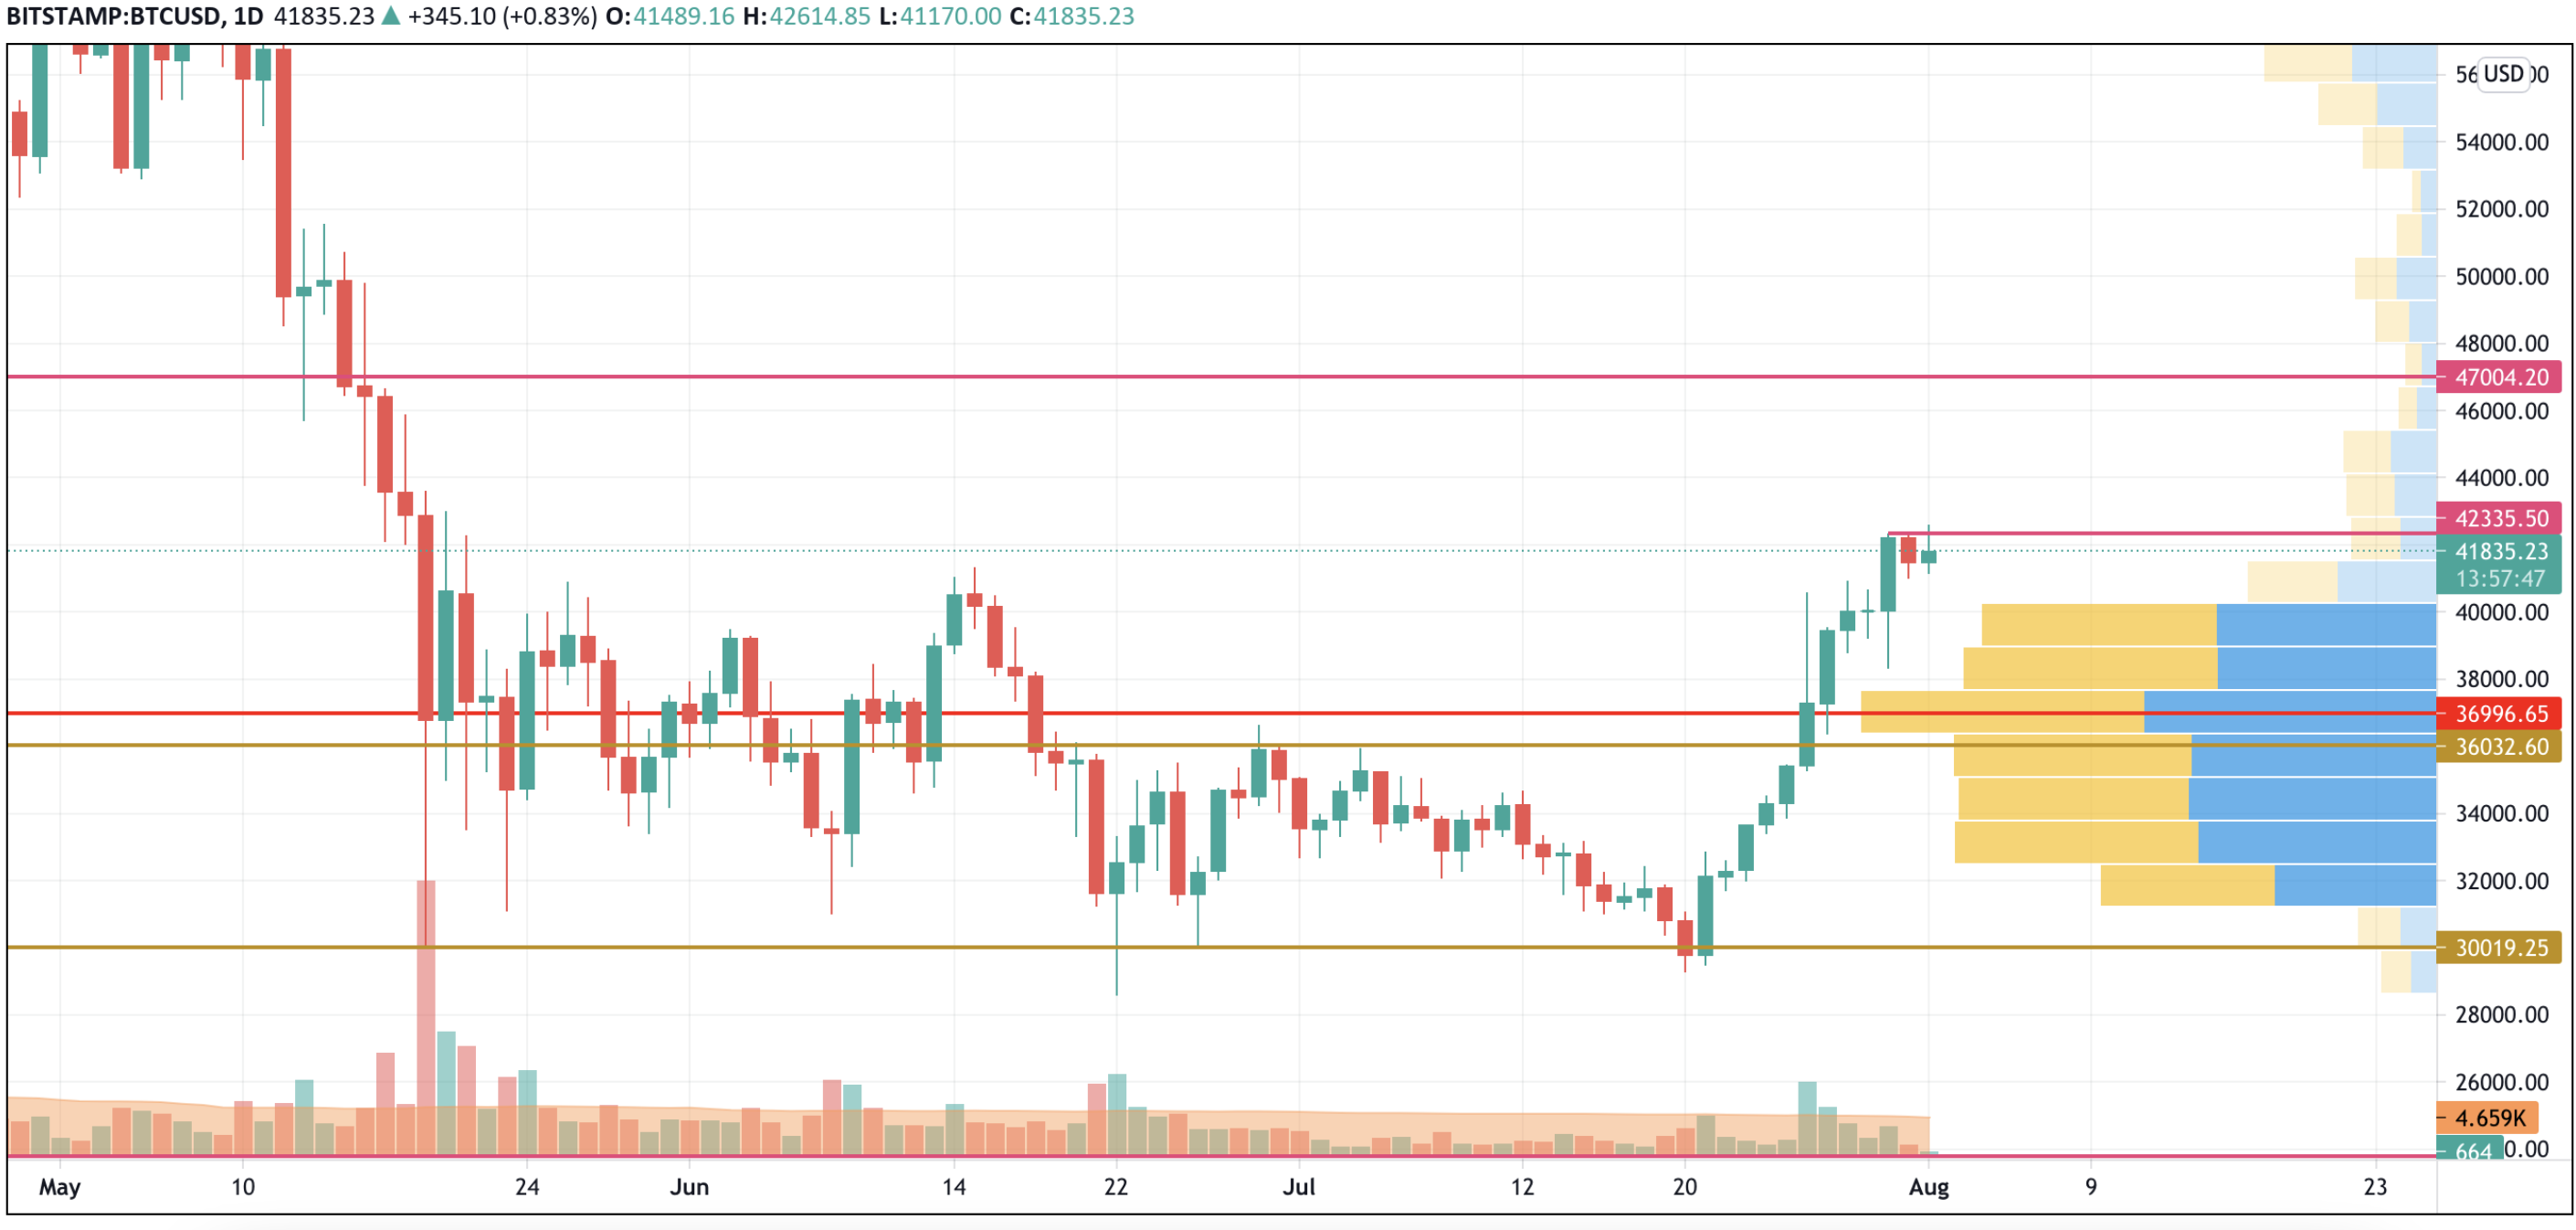
According to the weekly chart, Bitcoin (BTC) is about to break the resistance at $42,300 as bears are not showing any efforts to push the rate down. If the breakout occurs, the next area at which sellers can get back in the game is $47,000.
Bitcoin is trading at $41,821 at press time.