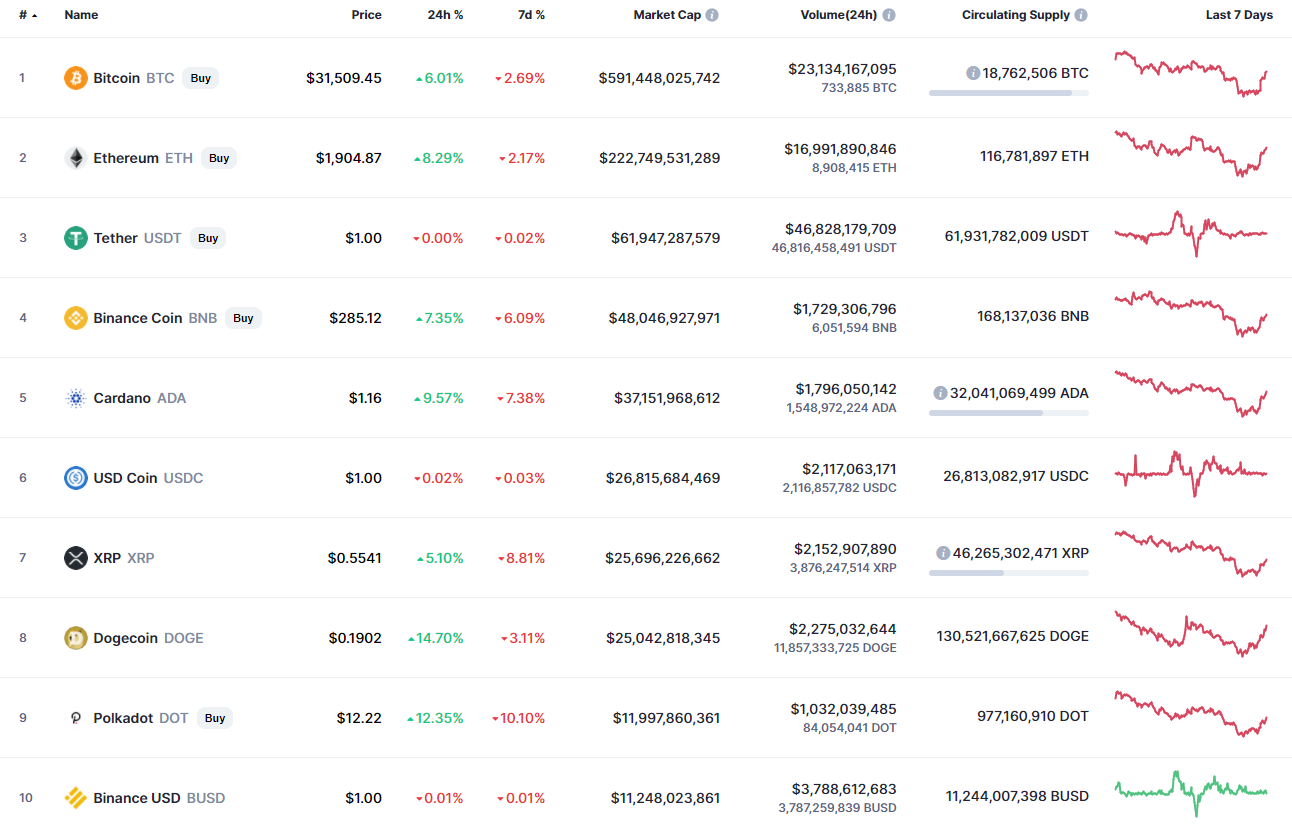
After a few days of continued decline, bulls have managed to seize the initiative. As a result, all of the top 10 coins are in the green zone.
BTC/USD
The rate of Bitcoin (BTC) has increased today by 6%.
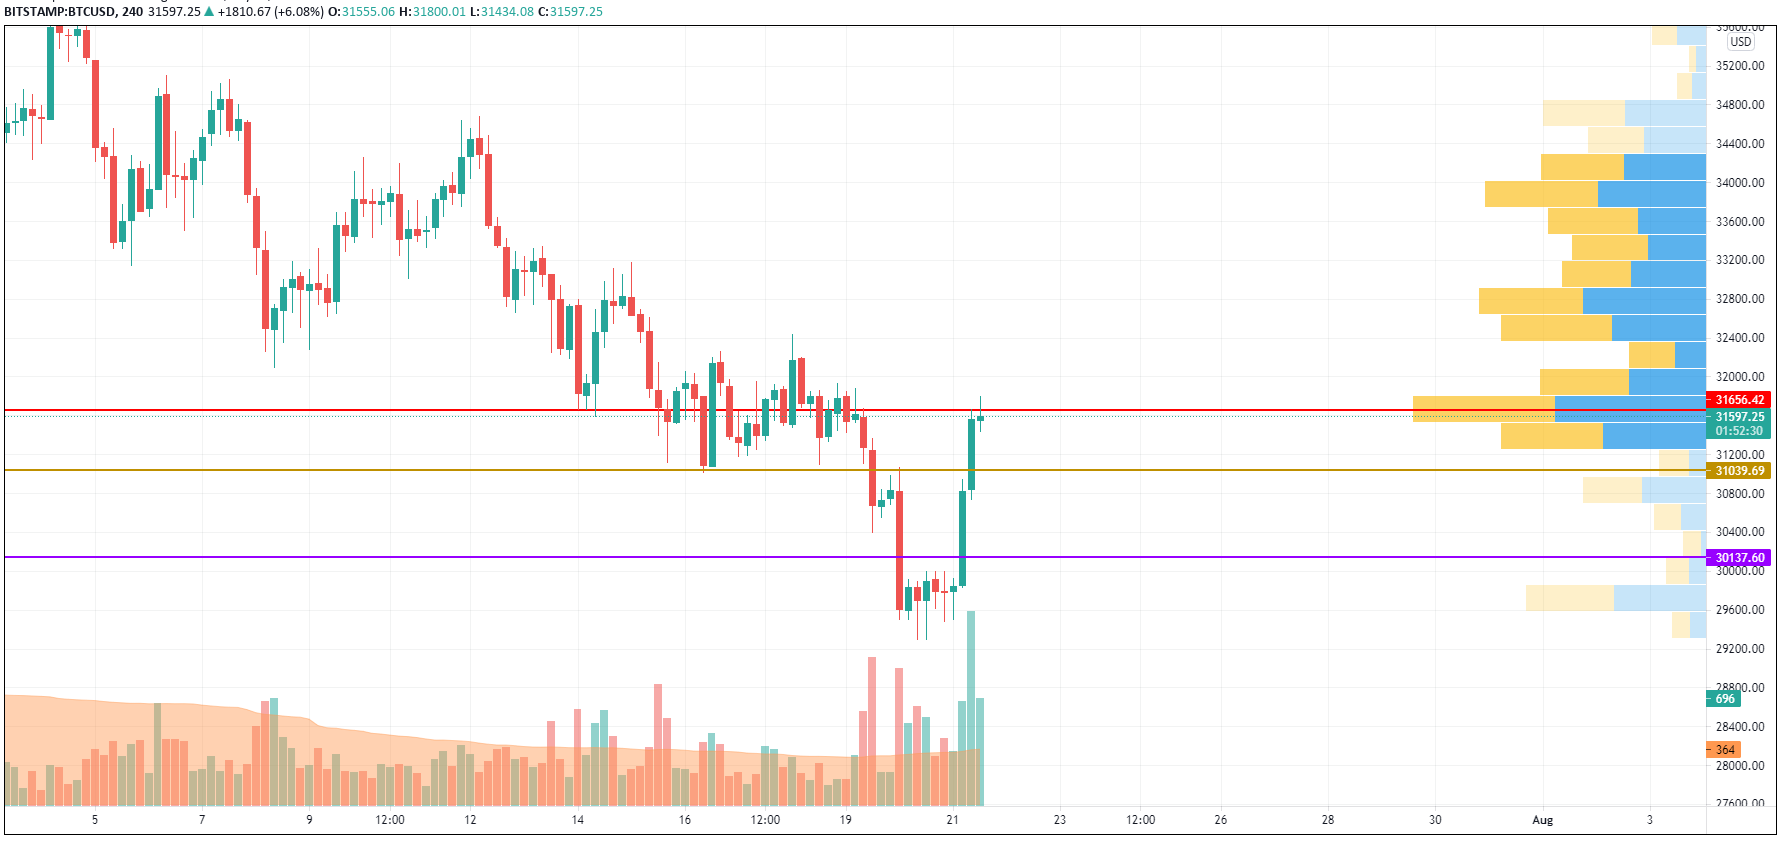
On the 4H chart, the buying trading volume is high, which means that bulls are dominating. However, Bitcoin (BTC) has entered the overbought zone where a slight decline may occur.
In this case, the drop may get the rate of the chief crypto to the nearest support around $31,000 per one coin.
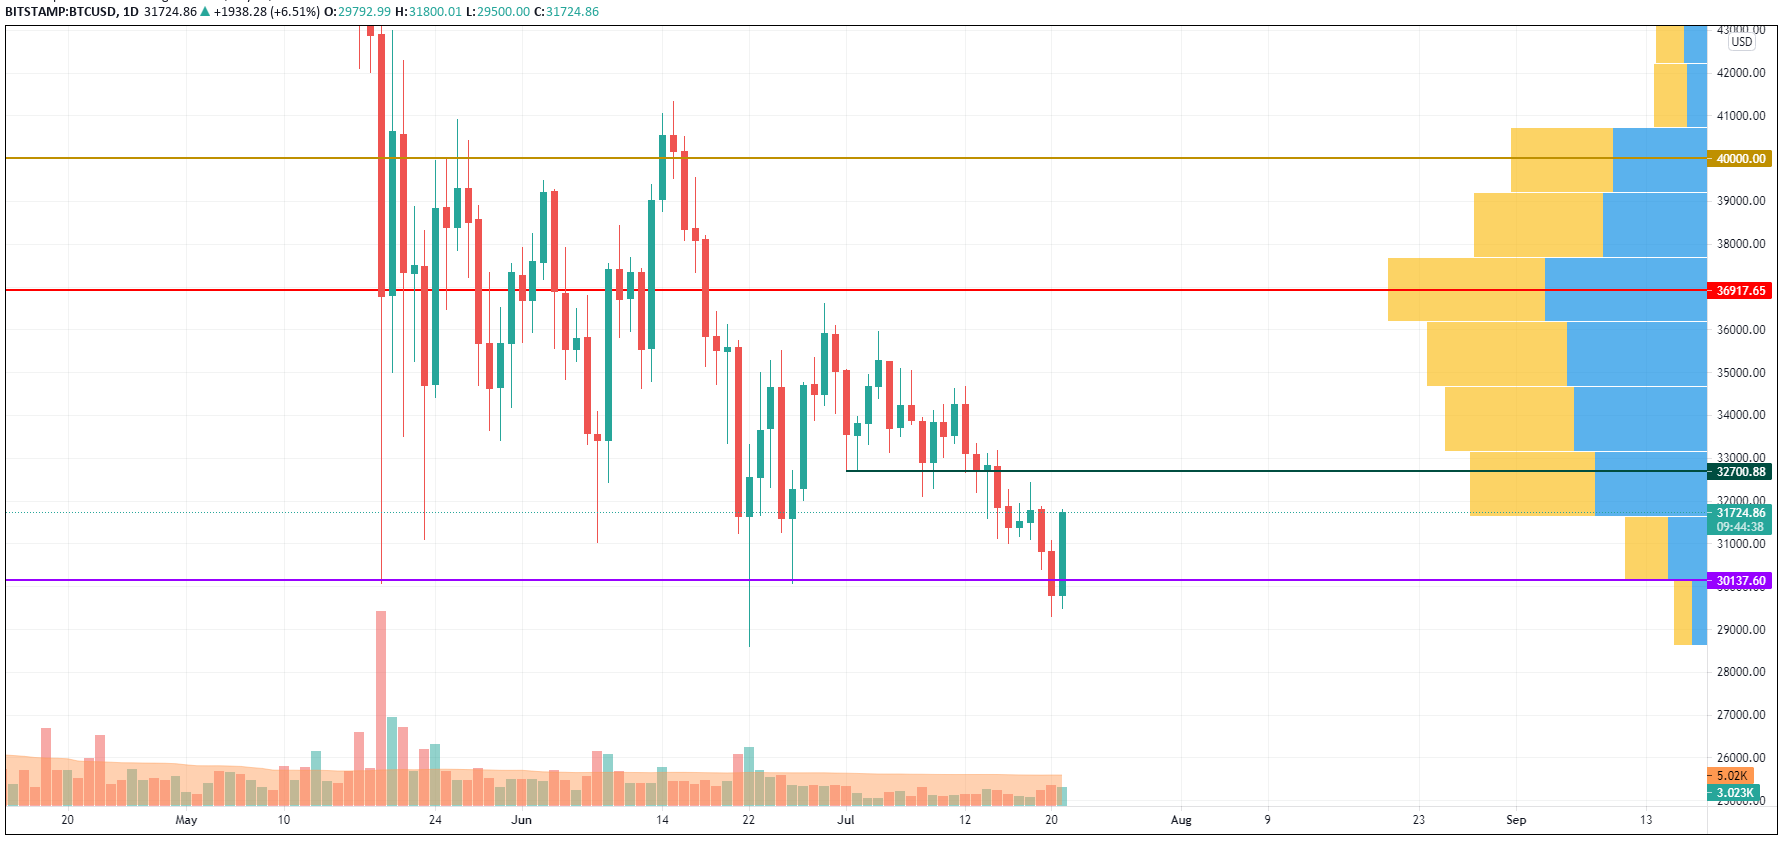
On the bigger time frame, Bitcoin (BTC) has shown a powerful bounceback from the level of $29,000. The trading volume is also rising, which is a good signal for continued growth. The closest level at which bears may seize the initiative is $32,700. However, such a scenario makes sense if the daily candle closes above $31,000.
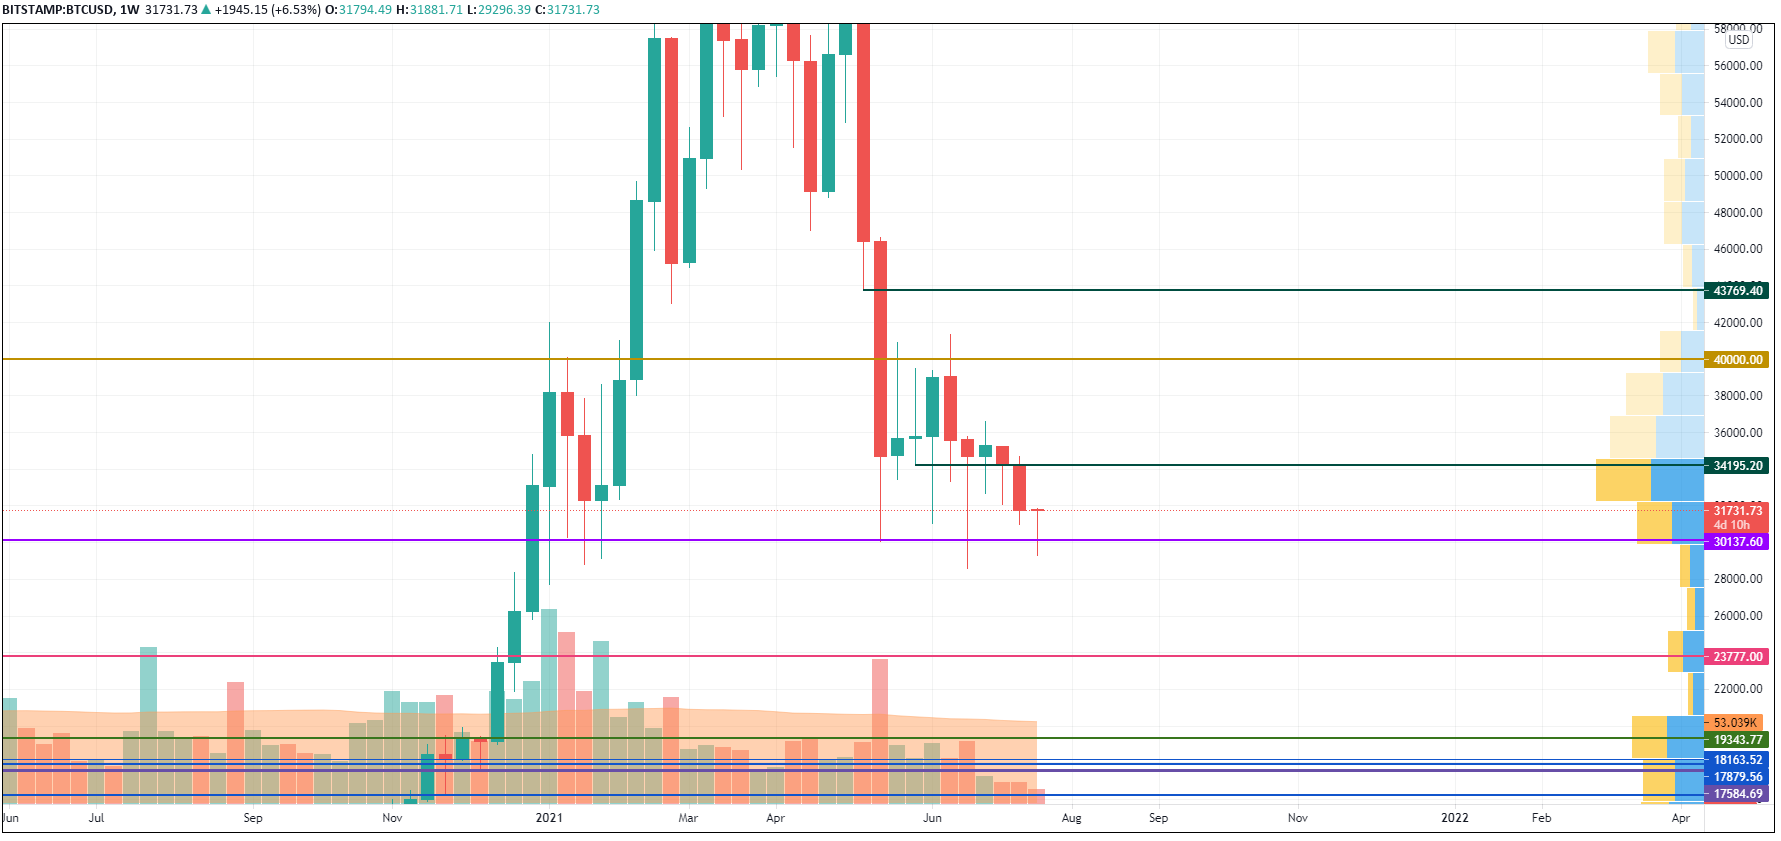
On the weekly chart, Bitcoin (BTC) has tested the support at $30,000 for the third time. Bulls are trying to hold this level while the price decrease may last until the $24,000 mark. Now, there are chances to test the resistance at $34,000 as the selling trading volume is at its lowest levels.
Bitcoin is trading at $31,678 at press time.